
Loading company details...
Explore prior quarterly filings, historical revenue breakdowns, and earnings trends.
Mastercard Q3 2026 Earnings: Services Lead Growth as Cash Flow Lags
Oct 30, 2026
Read
Mastercard Q1 2026 Financials: 10-Q Income Statement Analysis
Apr 30, 2026
Read
Mastercard 2025 10-K: Services Segment Drives 16% Revenue Growth
Feb 11, 2026
Read
Mastercard Q3 2025 Filing: Revenue Hits $8.6B, Profit Jumps 20%
Oct 31, 2025
Read
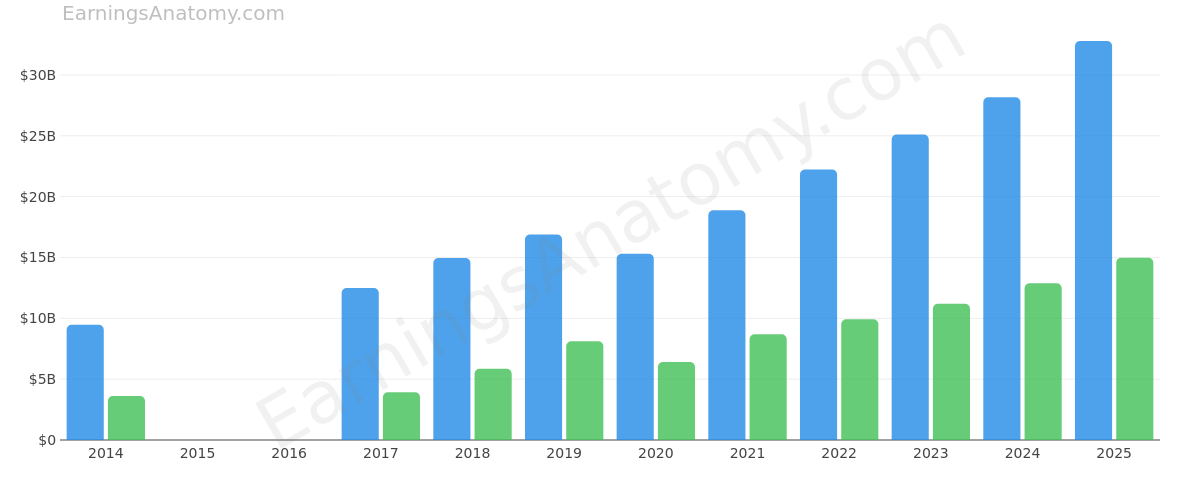
Loading interactive diagram…
Actions | Form 10-K 10-Q | Filing Date | Period | Analysis | Revenue | Net Income |
|---|---|---|---|---|---|---|
10-Q View Filing | Oct 29, 2026 | 2026 Q3 | Analysis | $9.81B | $4.63B | |
10-Q View Filing | Jul 30, 2026 | 2026 Q2 | - | $9.28B | $4.39B | |
10-Q View Filing | Apr 30, 2026 | 2026 Q1 | Analysis | $8.4B | $3.88B | |
10-K View Filing | Feb 11, 2026 | 2025 FY | Analysis | $32.79B | $14.97B | |
10-Q View Filing | Oct 30, 2025 | 2025 Q3 | Analysis | $8.6B | $3.93B | |
10-Q View Filing | Jul 31, 2025 | 2025 Q2 | Analysis | $8.13B | $3.7B | |
10-Q View Filing | May 1, 2025 | 2025 Q1 | - | $7.25B | $3.28B | |
10-K View Filing | Feb 12, 2025 | 2024 FY | - | $28.17B | $12.87B | |
10-Q View Filing | Oct 31, 2024 | 2024 Q3 | - | $7.37B | $3.26B | |
10-Q View Filing | Jul 31, 2024 | 2024 Q2 | - | $6.96B | $3.26B | |
10-Q View Filing | May 1, 2024 | 2024 Q1 | - | $6.35B | $3.01B | |
10-K View Filing | Feb 13, 2024 | 2023 FY | - | $25.1B | $11.2B | |
10-Q View Filing | Oct 26, 2023 | 2023 Q3 | - | $6.53B | $3.2B | |
10-Q View Filing | Jul 27, 2023 | 2023 Q2 | - | $6.27B | $2.85B | |
10-Q View Filing | Apr 27, 2023 | 2023 Q1 | - | $5.75B | $2.36B | |
10-K View Filing | Feb 14, 2023 | 2022 FY | - | $22.24B | $9.93B | |
10-Q View Filing | Oct 27, 2022 | 2022 Q3 | - | $5.76B | $2.5B | |
10-Q View Filing | Jul 28, 2022 | 2022 Q2 | - | $5.5B | $2.27B | |
10-Q View Filing | Apr 28, 2022 | 2022 Q1 | - | $5.17B | $2.63B | |
10-K View Filing | Feb 11, 2022 | 2021 FY | - | $18.88B | $8.69B | |
10-Q View Filing | Oct 28, 2021 | 2021 Q3 | - | $4.99B | $2.41B | |
10-Q View Filing | Jul 29, 2021 | 2021 Q2 | - | $4.53B | $2.07B | |
10-Q View Filing | Apr 29, 2021 | 2021 Q1 | - | $4.16B | $1.83B | |
10-K View Filing | Feb 12, 2021 | 2020 FY | - | $15.3B | $6.41B | |
10-Q View Filing | Oct 28, 2020 | - | - | - | - | |
10-Q View Filing | Jul 30, 2020 | - | - | - | - | |
10-Q View Filing | Apr 29, 2020 | - | - | - | - | |
10-K View Filing | Feb 14, 2020 | 2019 FY | - | $16.88B | $8.12B | |
10-Q View Filing | Oct 29, 2019 | - | - | - | - | |
10-Q View Filing | Jul 30, 2019 | - | - | - | - | |
10-Q View Filing | Apr 30, 2019 | - | - | - | - | |
10-K View Filing | Feb 13, 2019 | 2018 FY | - | $14.95B | $5.86B | |
10-Q View Filing | Oct 30, 2018 | - | - | - | - | |
10-Q View Filing | Jul 26, 2018 | - | - | - | - | |
10-Q View Filing | May 2, 2018 | - | - | - | - | |
10-K View Filing | Feb 14, 2018 | 2017 FY | - | $12.5B | $3.92B | |
10-Q View Filing | Oct 31, 2017 | - | - | - | - | |
10-Q View Filing | Jul 27, 2017 | - | - | - | - | |
10-Q View Filing | May 2, 2017 | - | - | - | - | |
10-K View Filing | Feb 15, 2017 | - | - | - | - | |
10-Q View Filing | Oct 28, 2016 | - | - | - | - | |
10-Q View Filing | Jul 28, 2016 | - | - | - | - | |
10-Q View Filing | Apr 28, 2016 | - | - | - | - | |
10-K View Filing | Feb 12, 2016 | - | - | - | - | |
10-Q View Filing | Oct 29, 2015 | - | - | - | - | |
10-Q View Filing | Jul 29, 2015 | - | - | - | - | |
10-Q View Filing | Apr 29, 2015 | - | - | - | - | |
10-K View Filing | Feb 13, 2015 | 2014 FY | - | $9.47B | $3.62B | |
10-Q View Filing | Oct 30, 2014 | - | - | - | - | |
10-Q View Filing | Jul 31, 2014 | - | - | - | - |
Scroll for more