
Loading company details...
Explore prior quarterly filings, historical revenue breakdowns, and earnings trends.
Texas Instruments Q3 2026 10-Q: Analog Recovery Drives 78% Profit Surge & Record Free Cash Flow
Oct 23, 2026
Read
Texas Instruments Q2 2026: Analog Strength Drives Margin Expansion
Jul 27, 2026
Read
Texas Instruments (TXN) Q1 2026: 19% Growth & CHIPS Act Funding
Apr 25, 2026
Read
Texas Instruments 2025: Analog Strength Drives Recovery Amid Embedded Headwinds
Feb 7, 2026
Read
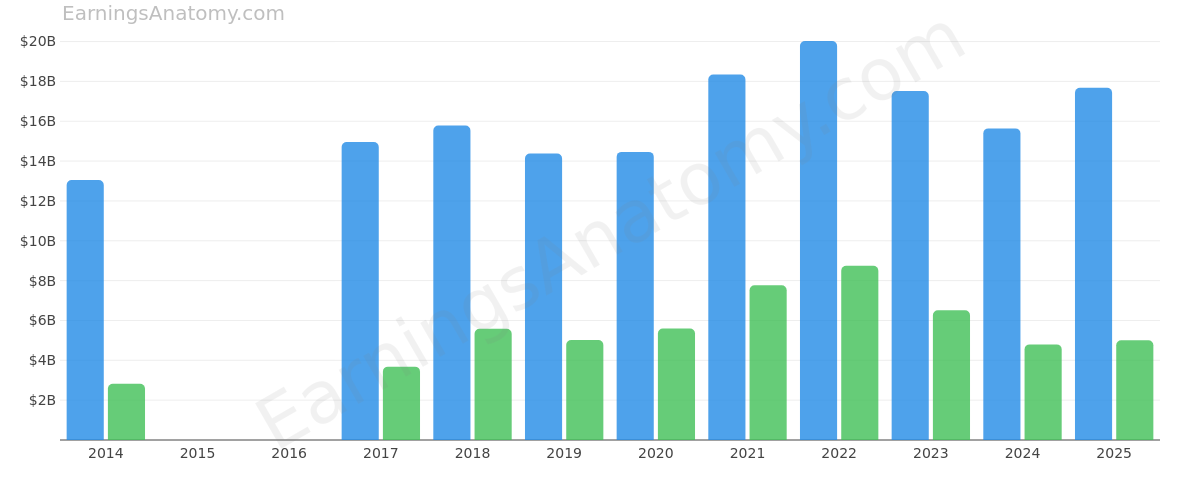
Loading interactive diagram…
Actions | Form 10-K 10-Q | Filing Date | Period | Analysis | Revenue | Net Income |
|---|---|---|---|---|---|---|
10-Q View Filing | Oct 23, 2026 | 2026 Q3 | Analysis | $6.05B | $2.42B | |
10-Q View Filing | Jul 24, 2026 | 2026 Q2 | Analysis | $5.46B | $1.98B | |
10-Q View Filing | Apr 24, 2026 | 2026 Q1 | Analysis | $4.83B | $1.54B | |
10-K View Filing | Feb 6, 2026 | 2025 FY | Analysis | $17.68B | $5B | |
10-Q View Filing | Oct 23, 2025 | 2025 Q3 | Analysis | $4.74B | $1.36B | |
10-Q View Filing | Jul 29, 2025 | 2025 Q2 | Analysis | $4.45B | $1.29B | |
10-Q View Filing | Apr 24, 2025 | 2025 Q1 | - | $4.07B | $1.18B | |
10-K View Filing | Feb 14, 2025 | 2024 FY | - | $15.64B | $4.8B | |
10-Q View Filing | Oct 23, 2024 | 2024 Q3 | - | $4.15B | $1.36B | |
10-Q View Filing | Jul 24, 2024 | 2024 Q2 | - | $3.82B | $1.13B | |
10-Q View Filing | Apr 24, 2024 | 2024 Q1 | - | $3.66B | $1.1B | |
10-K View Filing | Feb 2, 2024 | 2023 FY | - | $17.52B | $6.51B | |
10-Q View Filing | Oct 25, 2023 | 2023 Q3 | - | $4.53B | $1.71B | |
10-Q View Filing | Jul 26, 2023 | 2023 Q2 | - | $4.53B | $1.72B | |
10-Q View Filing | Apr 26, 2023 | 2023 Q1 | - | $4.38B | $1.71B | |
10-K View Filing | Feb 3, 2023 | 2022 FY | - | $20.03B | $8.75B | |
10-Q View Filing | Oct 26, 2022 | 2022 Q3 | - | $5.24B | $2.29B | |
10-Q View Filing | Jul 27, 2022 | 2022 Q2 | - | $5.21B | $2.29B | |
10-Q View Filing | Apr 27, 2022 | 2022 Q1 | - | $4.91B | $2.2B | |
10-K View Filing | Feb 4, 2022 | 2021 FY | - | $18.34B | $7.77B | |
10-Q View Filing | Oct 27, 2021 | 2021 Q3 | - | $4.64B | $1.95B | |
10-Q View Filing | Jul 22, 2021 | 2021 Q2 | - | $4.58B | $1.93B | |
10-Q View Filing | Apr 28, 2021 | 2021 Q1 | - | $4.29B | $1.75B | |
10-K View Filing | Feb 5, 2021 | 2020 FY | - | $14.46B | $5.59B | |
10-Q View Filing | Oct 21, 2020 | 2020 Q3 | - | $3.82B | $1.35B | |
10-Q View Filing | Jul 22, 2020 | 2020 Q2 | - | $3.24B | $1.38B | |
10-Q View Filing | Apr 22, 2020 | - | - | - | - | |
10-K View Filing | Feb 20, 2020 | 2019 FY | - | $14.38B | $5.02B | |
10-Q View Filing | Oct 31, 2019 | - | - | - | - | |
10-Q View Filing | Jul 31, 2019 | - | - | - | - | |
10-Q View Filing | Apr 30, 2019 | - | - | - | - | |
10-K View Filing | Feb 22, 2019 | 2018 FY | - | $15.78B | $5.58B | |
10-Q View Filing | Nov 2, 2018 | - | - | - | - | |
10-Q View Filing | Aug 2, 2018 | - | - | - | - | |
10-Q View Filing | May 3, 2018 | - | - | - | - | |
10-K View Filing | Feb 22, 2018 | 2017 FY | - | $14.96B | $3.68B | |
10-Q View Filing | Nov 2, 2017 | - | - | - | - | |
10-Q View Filing | Aug 3, 2017 | - | - | - | - | |
10-Q View Filing | May 3, 2017 | - | - | - | - | |
10-K View Filing | Feb 23, 2017 | - | - | - | - | |
10-Q View Filing | Nov 3, 2016 | - | - | - | - | |
10-Q View Filing | Aug 4, 2016 | - | - | - | - | |
10-Q View Filing | May 4, 2016 | - | - | - | - | |
10-K View Filing | Feb 24, 2016 | - | - | - | - | |
10-Q View Filing | Nov 5, 2015 | - | - | - | - | |
10-Q View Filing | Aug 4, 2015 | - | - | - | - | |
10-Q View Filing | May 5, 2015 | - | - | - | - | |
10-K View Filing | Feb 24, 2015 | 2014 FY | - | $13.04B | $2.82B | |
10-Q View Filing | Oct 31, 2014 | - | - | - | - | |
10-Q View Filing | Jul 31, 2014 | - | - | - | - |
Scroll for more