
Loading company details...
Explore prior quarterly filings, historical revenue breakdowns, and earnings trends.
Las Vegas Sands Q3 2026 Analysis: Gaming Shifts and Asian Resort Trends
Oct 23, 2026
Read
Las Vegas Sands Q2 2026: Hold Volatility Hits Macao Margins
Jul 29, 2026
Read
Las Vegas Sands (LVS) Q1 2026: Asia Strategy Fuels 25% Revenue Growth
Apr 25, 2026
Read
Las Vegas Sands 2025 Report: Singapore Surges, Macao Stabilizes
Feb 8, 2026
Read
Loading interactive diagram…
Actions | Form 10-K 10-Q | Filing Date | Period | Analysis | Revenue | Net Income |
|---|---|---|---|---|---|---|
10-Q View Filing | Oct 23, 2026 | 2026 Q3 | Analysis | $3.22B | $352M | |
10-Q View Filing | Jul 24, 2026 | 2026 Q2 | Analysis | $3.15B | $373M | |
10-Q View Filing | Apr 24, 2026 | 2026 Q1 | Analysis | $3.58B | $641M | |
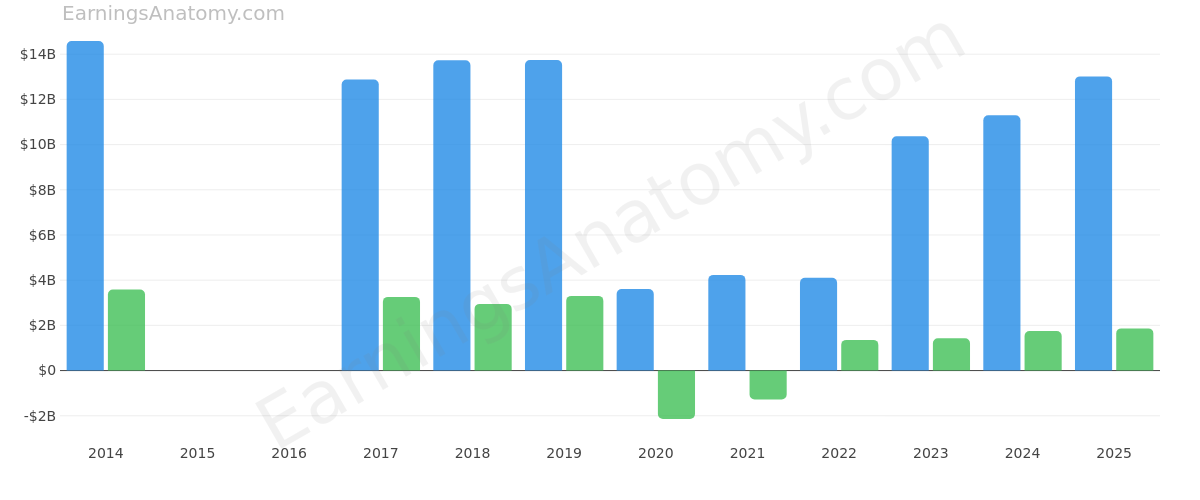
10-K View Filing | Feb 6, 2026 | 2025 FY | Analysis | $13.02B | $1.87B | |
10-Q View Filing | Oct 24, 2025 | 2025 Q3 | - | $3.33B | $491M | |
10-Q View Filing | Jul 25, 2025 | 2025 Q2 | - | |||
10-Q View Filing | Apr 25, 2025 | 2025 Q1 | - | $2.86B | $408M | |
10-K View Filing | Feb 7, 2025 | 2024 FY | - | $11.3B | $1.75B | |
10-Q View Filing | Oct 25, 2024 | - | - | - | - | |
10-Q View Filing | Jul 26, 2024 | - | - | - | - | |
10-Q View Filing | Apr 19, 2024 | - | - | - | - | |
10-K View Filing | Feb 7, 2024 | 2023 FY | - | $10.37B | $1.43B | |
10-Q View Filing | Oct 20, 2023 | - | - | - | - | |
10-Q View Filing | Jul 21, 2023 | - | - | - | - | |
10-Q View Filing | Apr 21, 2023 | - | - | - | - | |
10-K View Filing | Feb 3, 2023 | 2022 FY | - | $4.11B | $1.36B | |
10-Q View Filing | Oct 21, 2022 | - | - | - | - | |
10-Q View Filing | Jul 22, 2022 | - | - | - | - | |
10-Q View Filing | Apr 29, 2022 | - | - | - | - | |
10-K View Filing | Feb 4, 2022 | 2021 FY | - | $4.23B | -$1.28B | |
10-Q View Filing | Oct 22, 2021 | - | - | - | - | |
10-Q View Filing | Jul 23, 2021 | - | - | - | - | |
10-Q View Filing | Apr 23, 2021 | - | - | - | - | |
10-K View Filing | Feb 5, 2021 | 2020 FY | - | $3.61B | -$2.14B | |
10-Q View Filing | Oct 23, 2020 | - | - | - | - | |
10-Q View Filing | Jul 24, 2020 | - | - | - | - | |
10-Q View Filing | Apr 24, 2020 | - | - | - | - | |
10-K View Filing | Feb 7, 2020 | 2019 FY | - | $13.74B | $3.3B | |
10-Q View Filing | Oct 25, 2019 | - | - | - | - | |
10-Q View Filing | Jul 24, 2019 | - | - | - | - | |
10-Q View Filing | Apr 19, 2019 | - | - | - | - | |
10-K View Filing | Feb 22, 2019 | 2018 FY | - | $13.73B | $2.95B | |
10-Q View Filing | Oct 26, 2018 | - | - | - | - | |
10-Q View Filing | Jul 25, 2018 | - | - | - | - | |
10-Q View Filing | Apr 27, 2018 | - | - | - | - | |
10-K View Filing | Feb 23, 2018 | 2017 FY | - | $12.88B | $3.26B | |
10-Q View Filing | Nov 3, 2017 | - | - | - | - | |
10-Q View Filing | Aug 4, 2017 | - | - | - | - | |
10-Q View Filing | May 5, 2017 | - | - | - | - | |
10-K View Filing | Feb 24, 2017 | - | - | - | - | |
10-Q View Filing | Nov 4, 2016 | - | - | - | - | |
10-Q View Filing | Aug 5, 2016 | - | - | - | - | |
10-Q View Filing | May 6, 2016 | - | - | - | - | |
10-K View Filing | Feb 26, 2016 | - | - | - | - | |
10-Q View Filing | Nov 5, 2015 | - | - | - | - | |
10-Q View Filing | Aug 7, 2015 | - | - | - | - | |
10-Q View Filing | May 7, 2015 | - | - | - | - | |
10-K View Filing | Feb 27, 2015 | 2014 FY | - | $14.58B | $3.59B | |
10-Q View Filing | Nov 5, 2014 | - | - | - | - | |
10-Q View Filing | Aug 7, 2014 | - | - | - | - |
Scroll for more