
Loading company details...
Explore prior quarterly filings, historical revenue breakdowns, and earnings trends.
MGM Resorts Q3 2026: Operating Profit Rebounds as Adjusted EBITDA Falls 20.4%
Oct 30, 2026
Read
MGM Resorts Q2 2026 Analysis: Vegas Strength vs. Digital Headwinds
Aug 21, 2026
Read
MGM Resorts Q1 2026: Digital Growth Meets Margin Squeezes
Apr 30, 2026
Read
MGM 2025 10-K Analysis: Macau Surges, Vegas Cools, and the Cost of Rent
Feb 12, 2026
Read
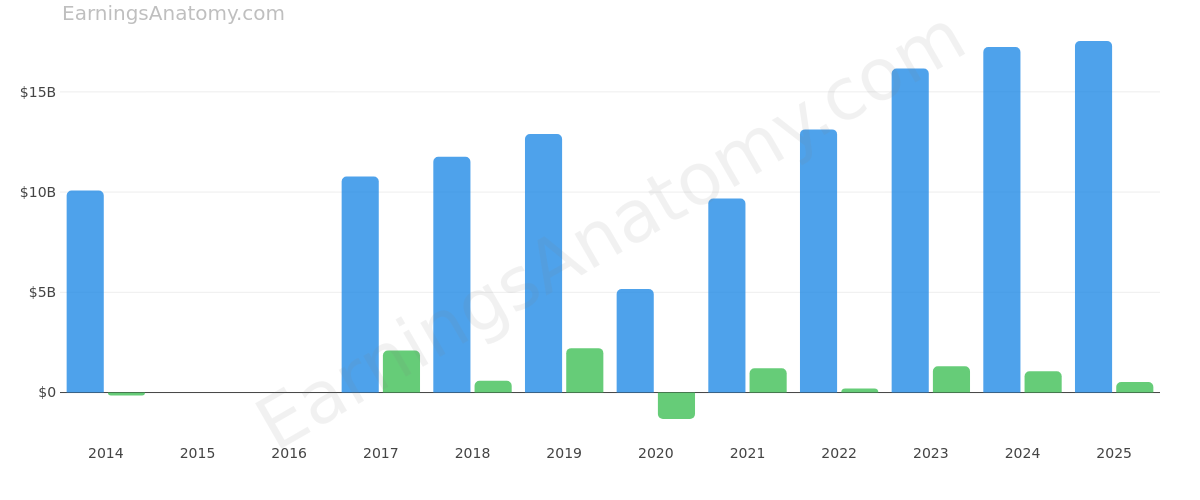
Loading interactive diagram…
Actions | Form 10-K 10-Q | Filing Date | Period | Analysis | Revenue | Net Income |
|---|---|---|---|---|---|---|
10-Q View Filing | Oct 28, 2026 | 2026 Q3 | Analysis | $4.21B | $39.21M | |
10-Q View Filing | Jul 29, 2026 | 2026 Q2 | Analysis | $4.45B | $322.79M | |
10-Q View Filing | Apr 29, 2026 | 2026 Q1 | Analysis | $4.45B | $174.79M | |
10-K View Filing | Feb 11, 2026 | 2025 FY | Analysis | $17.54B | $520.87M | |
10-Q View Filing | Oct 29, 2025 | 2025 Q3 | - | $4.25B | -$206.73M | |
10-Q View Filing | Jul 30, 2025 | 2025 Q2 | - | $4.4B | $118.09M | |
10-Q View Filing | Apr 30, 2025 | 2025 Q1 | - | $4.28B | $226.73M | |
10-K View Filing | Feb 18, 2025 | 2024 FY | - | $17.24B | $1.06B | |
10-Q View Filing | Oct 30, 2024 | - | - | - | - | |
10-Q View Filing | Jul 31, 2024 | - | - | - | - | |
10-Q View Filing | May 1, 2024 | - | - | - | - | |
10-K View Filing | Feb 23, 2024 | 2023 FY | - | $16.16B | $1.31B | |
10-Q View Filing | Nov 8, 2023 | - | - | - | - | |
10-Q View Filing | Aug 2, 2023 | - | - | - | - | |
10-Q View Filing | May 1, 2023 | - | - | - | - | |
10-K View Filing | Feb 24, 2023 | 2022 FY | - | $13.13B | $206.73M | |
10-Q View Filing | Nov 2, 2022 | - | - | - | - | |
10-Q View Filing | Aug 3, 2022 | - | - | - | - | |
10-Q View Filing | May 2, 2022 | - | - | - | - | |
10-K View Filing | Feb 25, 2022 | 2021 FY | - | $9.68B | $1.21B | |
10-Q View Filing | Nov 3, 2021 | - | - | - | - | |
10-Q View Filing | Aug 6, 2021 | - | - | - | - | |
10-Q View Filing | May 3, 2021 | - | - | - | - | |
10-K View Filing | Feb 26, 2021 | 2020 FY | - | $5.16B | -$1.32B | |
10-Q View Filing | Nov 3, 2020 | - | - | - | - | |
10-Q View Filing | Aug 3, 2020 | - | - | - | - | |
10-Q View Filing | May 1, 2020 | - | - | - | - | |
10-K View Filing | Feb 27, 2020 | 2019 FY | - | $12.9B | $2.21B | |
10-Q View Filing | Nov 5, 2019 | - | - | - | - | |
10-Q View Filing | Aug 8, 2019 | - | - | - | - | |
10-Q View Filing | May 7, 2019 | - | - | - | - | |
10-K View Filing | Feb 27, 2019 | 2018 FY | - | $11.76B | $583.89M | |
10-Q View Filing | Nov 7, 2018 | - | - | - | - | |
10-Q View Filing | Aug 3, 2018 | - | - | - | - | |
10-Q View Filing | May 7, 2018 | - | - | - | - | |
10-K View Filing | Mar 1, 2018 | 2017 FY | - | $10.77B | $2.1B | |
10-Q View Filing | Nov 9, 2017 | - | - | - | - | |
10-Q View Filing | Aug 8, 2017 | - | - | - | - | |
10-Q View Filing | May 9, 2017 | - | - | - | - | |
10-K View Filing | Mar 1, 2017 | - | - | - | - | |
10-Q View Filing | Nov 9, 2016 | - | - | - | - | |
10-Q View Filing | Aug 8, 2016 | - | - | - | - | |
10-Q View Filing | May 6, 2016 | - | - | - | - | |
10-K View Filing | Feb 29, 2016 | - | - | - | - | |
10-Q View Filing | Nov 6, 2015 | - | - | - | - | |
10-Q View Filing | Aug 7, 2015 | - | - | - | - | |
10-Q View Filing | May 8, 2015 | - | - | - | - | |
10-K View Filing | Mar 2, 2015 | 2014 FY | - | $10.08B | -$149.87M | |
10-Q View Filing | Nov 7, 2014 | - | - | - | - | |
10-Q View Filing | Aug 11, 2014 | - | - | - | - |
Scroll for more