Loading blog posts...
August 11, 2026 • 4 min read
Warren Buffett’s sprawling conglomerate, Berkshire Hathaway, just opened its books for the second quarter of 2026. Digging into the income statement of a company with operations spanning from railroads and energy to insurance and candy is no small task, but doing so provides a fascinating pulse check on the broader economy. Let's unpack the numbers from their latest 10-Q filing to see how the Omaha-based giant navigated the quarter and what we can glean from its massive, diversified business model.
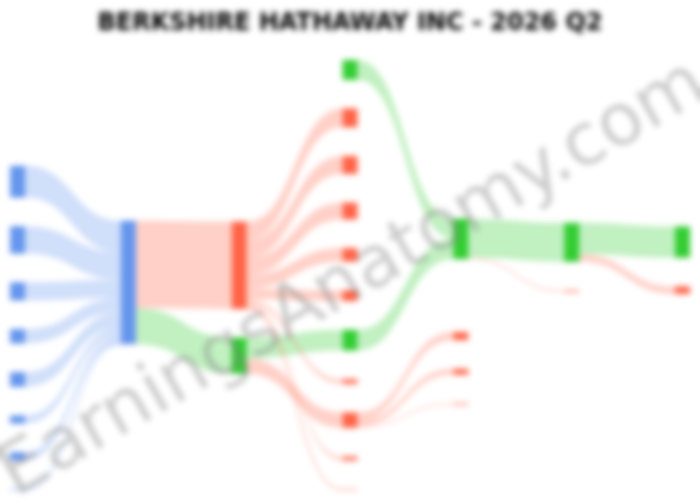
In the visual breakdown above, you might notice small unallocated revenue ($794 million) and unallocated cost of revenue ($688 million) buckets. These represent corporate-level activities and standard accounting eliminations between Berkshire's numerous subsidiaries that don't neatly fit into a single operating segment, ensuring the mathematical breakdown ties back perfectly to the consolidated totals.
Berkshire's insurance businesses—the engine that generates its massive "float" (premium money held before claims are paid)—had an eventful quarter. Total insurance revenue reached $26.2 billion. However, GEICO, the crown jewel of its primary insurance group, saw its pre-tax underwriting earnings drop to $994 million, down from $1.8 billion in Q2 2025. Why the squeeze? Drivers are simply getting into more accidents, driving up claims frequencies, and those accidents are costing more to fix, increasing average severities in bodily injury and property damage. GEICO also ramped up its advertising spend during the quarter.
Fortunately, Berkshire's reinsurance group stepped up to balance the scales, posting $913 million in pre-tax underwriting earnings (up from $650 million a year ago). This jump was heavily aided by lower-than-expected property losses and a welcome lack of significant catastrophe events—a stark contrast to the costly California wildfires that dented results early last year.
Beyond insurance, the BNSF railroad and Berkshire Hathaway Energy (BHE) divisions showed solid operational momentum. BNSF hauled in $6.6 billion in revenue, up a healthy 14.6% year-over-year. This was driven by a 6.5% bump in overall freight volumes—especially in consumer products and agricultural/energy shipments—along with higher fuel surcharge revenues.
BHE also posted an impressive 26.9% increase in net earnings, reaching $891 million. This boost largely benefited from higher retail customer volumes and favorable rate adjustments within its U.S. utilities footprint.
As always, Berkshire’s bottom line is heavily skewed by the stock market. The company reported a staggering $16.1 billion in investment gains for the quarter, a massive jump from $6.4 billion in Q2 2025. It is important to note that these are largely paper gains driven by the quarterly market price fluctuations of its top five equity holdings: Alphabet, American Express, Apple, Bank of America, and Coca-Cola. Buffett has long advised investors not to over-index on these unrealized gains, as they can swing wildly from quarter to quarter and distort the true operational performance of the businesses.
Perhaps the most fascinating takeaway from the filing is Berkshire's liquidity. The company is sitting on a historic cash fortress, holding nearly $325 billion in U.S. Treasury Bills alongside over $35 billion in cash and equivalents within its insurance segment alone. With this massive war chest yielding safe returns in the current interest rate environment, Berkshire deployed roughly $4.5 billion to aggressively repurchase its own Class A and Class B shares throughout the quarter.
Berkshire Hathaway’s Q2 2026 results showcase the resilience of its diversified model. When GEICO faces headwinds from rising claims inflation, the railroad, energy, and reinsurance segments pick up the slack. Armed with over a third of a trillion dollars in short-term liquidity, Berkshire remains uniquely positioned to weather any macroeconomic storms while patiently hunting for its next elephant-sized acquisition.
Last updated: August 11, 2026
Explore prior quarterly filings, historical revenue breakdowns, and earnings trends.
Visual breakdowns and margin trends from recent public company SEC filings.