Loading blog posts...
October 30, 2026 • 3 min read
Norwegian Cruise Line Holdings’ third-quarter results show why rising net income does not always mean stronger operations. A closer look at the income statement in its September 2026 10-Q reveals flat revenue, weaker ticket pricing and lower operating profit—even as reported earnings improved. The company operates Norwegian Cruise Line, upscale Oceania Cruises and luxury Regent Seven Seas Cruises.
Quarterly revenue increased just 0.3% to $2.95 billion, with a meaningful shift in its composition:
The more revealing comparison is against capacity. Capacity Days—available passenger berths multiplied by operating days—rose 5.4%, while occupancy barely changed at 106.5%. Occupancy can exceed 100% because some cabins accommodate more than two guests.
Despite that additional capacity, Net Yield fell 6.5% to $319.65. This company-defined measure tracks revenue after certain direct costs per Capacity Day. Management attributed flat revenue primarily to new ships being offset by declining ticket pricing.
That distinction matters: Norwegian filled its expanded capacity, but generated less revenue after certain direct costs for each available berth-day.
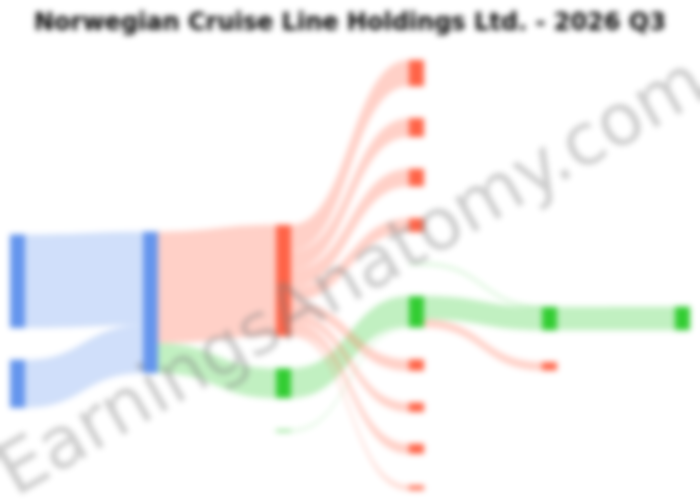
The diagram below traces the quarter’s revenue through expenses to net income.
Operating income declined 16.7% to $624.3 million, reducing the operating margin from 25.5% to 21.2%.
Cruise operating expenses increased 7.3% to $1.67 billion, primarily because of new ships. Payroll rose 9.8%, fuel expense increased 11.3%, and depreciation and amortization climbed 14.7%. The latter included a $16.8 million loss on the disposal of Oceania Sirena.
Cost discipline provided some relief. Marketing, general and administrative expenses fell 4.1%, while adjusted nonfuel cruise costs per Capacity Day declined 2.2% to $152.28. But those savings were insufficient to offset weaker yields.
Nevertheless, net income rose 17.2% to $491.5 million, and diluted earnings per share increased to $1.07 from $0.86. The principal explanation sits below operating income:
Removing management’s specified adjustments gives a different picture: adjusted net income fell 13.8% to $513.8 million, while adjusted EPS declined to $1.12 from $1.20.
For the first nine months, operating cash flow increased 4.6% to $1.71 billion, but remained below $2.29 billion of property and equipment additions. Balance-sheet debt, including its current portion, totaled approximately $15.1 billion.
After quarter-end, Norwegian issued $950 million of 8.75% notes due 2031 to refinance debt and repay borrowings, while expanding its revolving credit commitments to approximately $2.8 billion.
Contemporaneous coverage reported that Norwegian raised its full-year adjusted earnings forecast after beating quarterly guidance. Still, the income statement’s central lesson is cautionary: reported profit growth outpaced underlying operating performance. Against competitors such as Carnival and Royal Caribbean, Norwegian’s challenge is to turn added capacity into stronger yields while funding fleet investment and managing substantial debt.
Last updated: October 30, 2026
Visual breakdowns and margin trends from recent public company SEC filings.
Citizens Financial Group (CFG) Q3 2026: NII Expansion & Margin Growth
Oct 30, 2026
Read
Chubb Limited Q3 2026 10-Q Analysis: 84.1% Combined Ratio & $1.79B Investment Income
Oct 30, 2026
Read
MGM Resorts Q3 2026: Operating Profit Rebounds as Adjusted EBITDA Falls 20.4%
Oct 30, 2026
Read
Honeywell Aerospace (HONA) Q3 Earnings: Dissecting Post-Spin Margins and Capital Structure
Oct 30, 2026
Read