
Loading company details...
Explore prior quarterly filings, historical revenue breakdowns, and earnings trends.
AbbVie Q2 2026 Earnings: Skyrizi and Rinvoq Drive Post-Humira Growth
Aug 5, 2026
Read
AbbVie Q1 2026 Earnings: Skyrizi and Rinvoq Offset Humira Decline
May 9, 2026
Read
AbbVie Q3 2025 Analysis: Sacrificing Profit for Pipeline Growth
Nov 6, 2025
Read
AbbVie Q2 2025: Beyond Humira, A Tale of Two Profits
Aug 4, 2025
Read
Loading interactive diagram…
Actions | Form 10-K 10-Q | Filing Date | Period | Analysis | Revenue | Net Income |
|---|---|---|---|---|---|---|
10-Q View Filing | Aug 3, 2026 | 2026 Q2 | Analysis | $16.99B | $3.62B | |
10-Q View Filing | May 8, 2026 | 2026 Q1 | Analysis | $15B | $697M | |
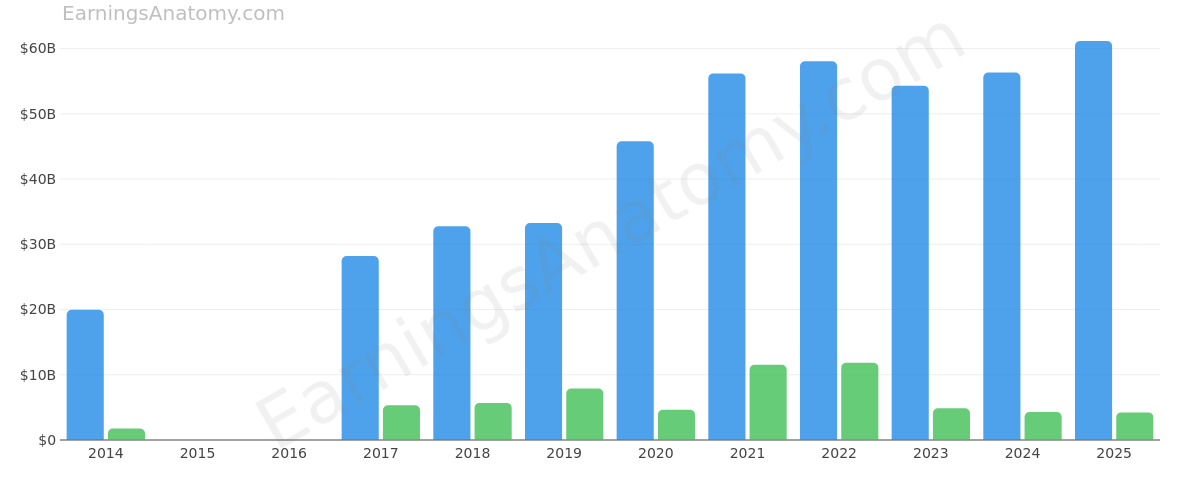
10-K View Filing | Feb 20, 2026 | 2025 FY | - | $61.16B | $4.23B | |
10-Q View Filing | Nov 4, 2025 | 2025 Q3 | Analysis | $15.78B | $188M | |
10-Q View Filing | Aug 4, 2025 | 2025 Q2 | Analysis | $15.42B | $941M | |
10-Q View Filing | May 9, 2025 | 2025 Q1 | - | $13.34B | $1.29B | |
10-K View Filing | Feb 14, 2025 | 2024 FY | - | $56.33B | $4.29B | |
10-Q View Filing | Nov 4, 2024 | - | - | - | - | |
10-Q View Filing | Aug 7, 2024 | - | - | - | - | |
10-Q View Filing | May 3, 2024 | - | - | - | - | |
10-K View Filing | Feb 20, 2024 | 2023 FY | - | $54.32B | $4.87B | |
10-Q View Filing | Nov 6, 2023 | - | - | - | - | |
10-Q View Filing | Aug 7, 2023 | - | - | - | - | |
10-Q View Filing | May 5, 2023 | - | - | - | - | |
10-K View Filing | Feb 17, 2023 | 2022 FY | - | $58.05B | $11.85B | |
10-Q View Filing | Nov 4, 2022 | - | - | - | - | |
10-Q View Filing | Aug 4, 2022 | - | - | - | - | |
10-Q View Filing | May 6, 2022 | - | - | - | - | |
10-K View Filing | Feb 18, 2022 | 2021 FY | - | $56.2B | $11.54B | |
10-Q View Filing | Nov 2, 2021 | - | - | - | - | |
10-Q View Filing | Aug 2, 2021 | - | - | - | - | |
10-Q View Filing | May 7, 2021 | - | - | - | - | |
10-K View Filing | Feb 19, 2021 | 2020 FY | - | $45.8B | $4.62B | |
10-Q View Filing | Nov 4, 2020 | - | - | - | - | |
10-Q View Filing | Aug 4, 2020 | - | - | - | - | |
10-Q View Filing | May 8, 2020 | - | - | - | - | |
10-K View Filing | Feb 21, 2020 | 2019 FY | - | $33.27B | $7.88B | |
10-Q View Filing | Nov 6, 2019 | - | - | - | - | |
10-Q View Filing | Aug 5, 2019 | - | - | - | - | |
10-Q View Filing | May 3, 2019 | - | - | - | - | |
10-K View Filing | Feb 27, 2019 | 2018 FY | - | $32.75B | $5.69B | |
10-Q View Filing | Nov 7, 2018 | - | - | - | - | |
10-Q View Filing | Aug 7, 2018 | - | - | - | - | |
10-Q View Filing | May 4, 2018 | - | - | - | - | |
10-K View Filing | Feb 16, 2018 | 2017 FY | - | $28.22B | $5.31B | |
10-Q View Filing | Nov 7, 2017 | - | - | - | - | |
10-Q View Filing | Aug 7, 2017 | - | - | - | - | |
10-Q View Filing | May 5, 2017 | - | - | - | - | |
10-K View Filing | Feb 17, 2017 | - | - | - | - | |
10-Q View Filing | Nov 7, 2016 | - | - | - | - | |
10-Q View Filing | Aug 5, 2016 | - | - | - | - | |
10-Q View Filing | May 6, 2016 | - | - | - | - | |
10-K View Filing | Feb 19, 2016 | - | - | - | - | |
10-Q View Filing | Nov 6, 2015 | - | - | - | - | |
10-Q View Filing | Aug 7, 2015 | - | - | - | - | |
10-Q View Filing | May 8, 2015 | - | - | - | - | |
10-K View Filing | Feb 20, 2015 | 2014 FY | - | $19.96B | $1.77B | |
10-Q View Filing | Nov 7, 2014 | - | - | - | - | |
10-Q View Filing | Aug 7, 2014 | - | - | - | - | |
10-Q View Filing | May 9, 2014 | - | - | - | - |
Scroll for more