
Loading company details...
Explore prior quarterly filings, historical revenue breakdowns, and earnings trends.
Verisign Q3 2026: Revenue Rises 5.7%, but Net Income Stays Flat
Oct 23, 2026
Read
Verisign Q2 2026: High-Margin Domain Registry Growth
Jul 24, 2026
Read
VeriSign Q1 2026: 68% Margins and the Official .Com Price Hike
Apr 25, 2026
Read
Verisign 2025 10-K Analysis: The Profitability of the Internet's Toll Road
Feb 6, 2026
Read
Loading interactive diagram…
Actions | Form 10-K 10-Q | Filing Date | Period | Analysis | Revenue | Net Income |
|---|---|---|---|---|---|---|
10-Q View Filing | Oct 22, 2026 | 2026 Q3 | Analysis | $443M | $212.6M | |
10-Q View Filing | Jul 23, 2026 | 2026 Q2 | Analysis | $434.6M | $216.5M | |
10-Q View Filing | Apr 23, 2026 | 2026 Q1 | Analysis | $428.9M | $214.5M | |
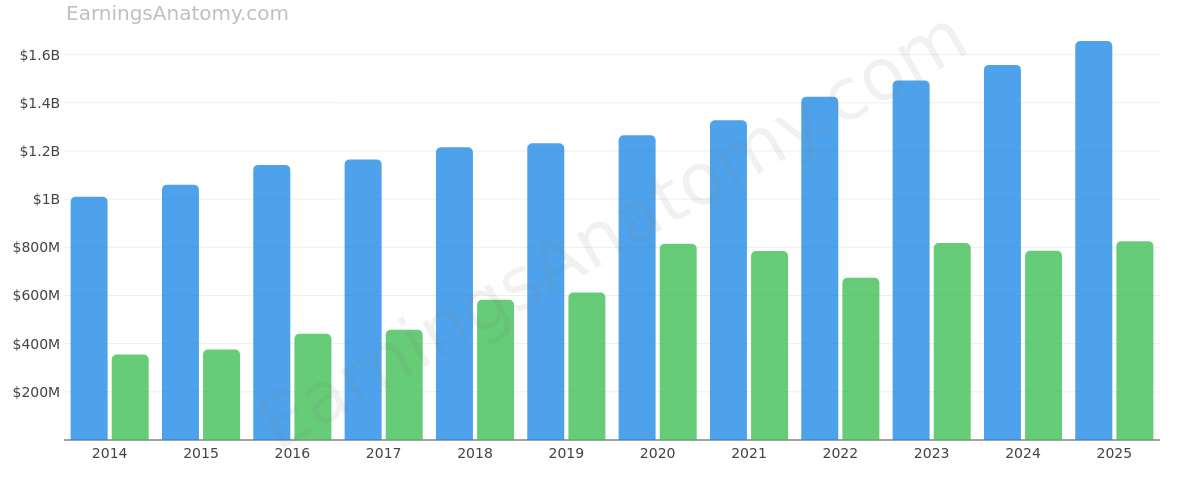
10-K View Filing | Feb 5, 2026 | 2025 FY | Analysis | $1.66B | $825.7M | |
10-Q View Filing | Oct 23, 2025 | 2025 Q3 | Analysis | $419.1M | $212.8M | |
10-Q View Filing | Jul 24, 2025 | 2025 Q2 | Analysis | $409.9M | $207.4M | |
10-Q View Filing | Apr 24, 2025 | 2025 Q1 | - | $402.3M | $199.3M | |
10-K View Filing | Feb 13, 2025 | 2024 FY | - | $1.56B | $785.7M | |
10-Q View Filing | Oct 24, 2024 | 2024 Q3 | - | $390.6M | $201.3M | |
10-Q View Filing | Jul 25, 2024 | 2024 Q2 | - | $387.1M | $198.8M | |
10-Q View Filing | Apr 25, 2024 | 2024 Q1 | - | $384.3M | $194.1M | |
10-K View Filing | Feb 15, 2024 | 2023 FY | - | $1.49B | $817.6M | |
10-Q View Filing | Oct 26, 2023 | 2023 Q3 | - | $376.3M | $188.5M | |
10-Q View Filing | Jul 27, 2023 | 2023 Q2 | - | $372M | $185.7M | |
10-Q View Filing | Apr 27, 2023 | 2023 Q1 | - | $364.4M | $178.7M | |
10-K View Filing | Feb 17, 2023 | 2022 FY | - | $1.42B | $673.8M | |
10-Q View Filing | Oct 27, 2022 | 2022 Q3 | - | $356.9M | $169.5M | |
10-Q View Filing | Jul 28, 2022 | 2022 Q2 | - | $351.9M | $167.3M | |
10-Q View Filing | Apr 28, 2022 | 2022 Q1 | - | $346.9M | $157.5M | |
10-K View Filing | Feb 18, 2022 | 2021 FY | - | $1.33B | $784.83M | |
10-Q View Filing | Oct 28, 2021 | 2021 Q3 | - | $334.24M | $156.62M | |
10-Q View Filing | Jul 22, 2021 | 2021 Q2 | - | $329.4M | $147.77M | |
10-Q View Filing | Apr 22, 2021 | 2021 Q1 | - | $323.62M | $150.35M | |
10-K View Filing | Feb 19, 2021 | 2020 FY | - | $1.27B | $814.89M | |
10-Q View Filing | Oct 22, 2020 | 2020 Q3 | - | $317.88M | $170.98M | |
10-Q View Filing | Jul 23, 2020 | 2020 Q2 | - | $314.37M | $152.48M | |
10-Q View Filing | Apr 23, 2020 | 2020 Q1 | - | $312.52M | $334.12M | |
10-K View Filing | Feb 14, 2020 | 2019 FY | - | $1.23B | $612.3M | |
10-Q View Filing | Oct 24, 2019 | 2019 Q3 | - | $308.42M | $153.91M | |
10-Q View Filing | Jul 25, 2019 | 2019 Q2 | - | $306.29M | $147.53M | |
10-Q View Filing | Apr 25, 2019 | 2019 Q1 | - | $306.41M | $162.53M | |
10-K View Filing | Feb 15, 2019 | 2018 FY | - | $1.21B | $582.49M | |
10-Q View Filing | Oct 25, 2018 | 2018 Q3 | - | $305.78M | $137.68M | |
10-Q View Filing | Jul 26, 2018 | 2018 Q2 | - | $302.45M | $128.35M | |
10-Q View Filing | Apr 26, 2018 | 2018 Q1 | - | $299.29M | $134.26M | |
10-K View Filing | Feb 16, 2018 | 2017 FY | - | $1.17B | $457.25M | |
10-Q View Filing | Oct 26, 2017 | 2017 Q3 | - | $292.43M | $114.9M | |
10-Q View Filing | Jul 27, 2017 | 2017 Q2 | - | $288.55M | $123.1M | |
10-Q View Filing | Apr 27, 2017 | 2017 Q1 | - | $288.61M | $116.41M | |
10-K View Filing | Feb 17, 2017 | 2016 FY | - | $1.14B | $440.64M | |
10-Q View Filing | Oct 27, 2016 | 2016 Q3 | - | $287.55M | $114.43M | |
10-Q View Filing | Jul 28, 2016 | 2016 Q2 | - | $286.47M | $113.21M | |
10-Q View Filing | Apr 28, 2016 | 2016 Q1 | - | $281.88M | $107.46M | |
10-K View Filing | Feb 19, 2016 | 2015 FY | - | $1.06B | $375.24M | |
10-Q View Filing | Oct 22, 2015 | 2015 Q3 | - | $265.78M | $92.46M | |
10-Q View Filing | Jul 23, 2015 | 2015 Q2 | - | $262.54M | $93.01M | |
10-Q View Filing | Apr 23, 2015 | 2015 Q1 | - | $258.42M | $88.24M | |
10-K View Filing | Feb 13, 2015 | 2014 FY | - | $1.01B | $355.26M | |
10-Q View Filing | Oct 23, 2014 | 2014 Q3 | - | $255.02M | $95.19M | |
10-Q View Filing | Jul 24, 2014 | 2014 Q2 | - | $250.38M | $100.18M |
Scroll for more