Loading blog posts...
July 24, 2026 • 4 min read
ServiceNow, the enterprise workflow-automation giant that now brands itself as the "AI control tower for business reinvention," just delivered a quarter where the top line looked terrific and the bottom line looked surprisingly soft. That gap is worth understanding, and it says a lot about the company's aggressive M&A strategy. Let's dig into the Q2 2026 10-Q to see what's actually driving the numbers.
For the uninitiated, ServiceNow (NYSE: NOW) sells a cloud platform that automates and digitizes workflows across IT, HR, customer service, and increasingly security and CRM. It competes with the likes of Salesforce, Microsoft, and Atlassian, and its core selling point is a single platform that stitches AI, data, and workflows together across an enterprise.
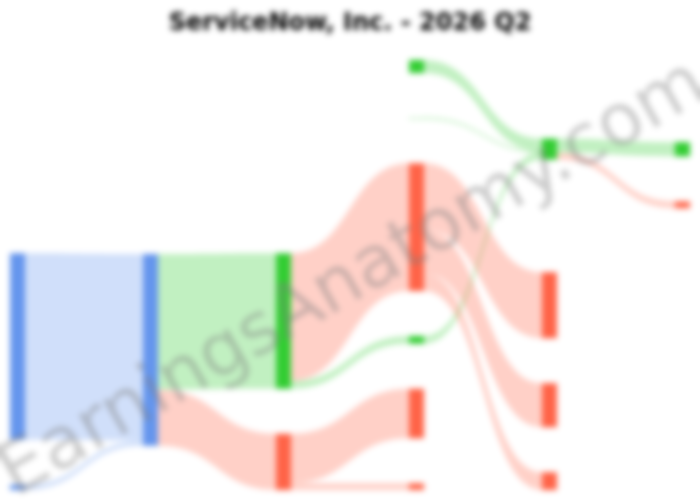
The demand story remains excellent. Total revenue hit $3.99 billion, up 24% from $3.22 billion a year ago. The engine here is subscription revenue—recurring fees for access to the platform—which rose 25% to $3.88 billion, or 97% of the total. Professional services (implementation and consulting) is a rounding error at $110 million and, as always, runs at a loss (a –26% gross margin), serving mainly to drive subscription adoption.
Geographically, growth was broad-based: North America grew to $2.52 billion, EMEA to $997 million, and Asia Pacific to $468 million. Management also flagged that annual contract value tied to AI products surpassed $1 billion, a signal that ServiceNow's generative-AI bets (including the recently acquired Moveworks agentic-AI tech) are converting into real dollars.
Here's the eye-catcher: despite 24% revenue growth, GAAP operating income collapsed to $162 million from $358 million, and operating margin fell to a thin 4.1%. Net income dropped to $298 million ($0.29 per share) from $385 million ($0.37) a year ago.
What happened? This is the cost of ServiceNow's acquisition binge. In April 2026 the company closed its $7.75 billion all-cash purchase of Armis (cyber asset intelligence) and also acquired Veza (identity governance)—together adding roughly $6.3 billion of goodwill and $2.9 billion of intangible assets to the balance sheet. Those deals lit up the income statement:
Strip these out, and non-GAAP operating income actually rose 23% to $1.17 billion—which is how management prefers you to read the quarter. The GAAP-to-non-GAAP gap is unusually wide right now precisely because of integration noise.
Funding two multibillion-dollar deals reshaped ServiceNow's capital structure. The company issued $4 billion in new senior notes (coupons ranging from 4.25% to 6.30%), drew on a term loan, and tapped $2.1 billion of commercial paper. Total debt now sits around $7.5 billion, versus essentially just $1.5 billion of legacy notes at year-end. Investing outflows of $7.1 billion (almost all acquisitions) and $2.2 billion in stock buybacks drained cash, and the cash balance fell to $2.5 billion.
One bright spot buried in the "Other income" line: a $272 million gain (largely from $360 million of unrealized gains on strategic investments—ServiceNow's portfolio of stakes in private tech companies). This lifted pre-tax income, though a jump in the effective tax rate to 32% (from 18%) blunted the benefit at the net level.
ServiceNow's underlying subscription business is firing on all cylinders, and its AI monetization is finally material. The messy GAAP margins this quarter are the price of transforming into a security-and-AI platform via expensive M&A—amortization, dilution, and severance will keep weighing on reported profits for several quarters. The bet is that Armis and Veza deepen ServiceNow's moat against Salesforce and Microsoft in the fast-growing security and identity space. Whether that $10 billion of goodwill and intangibles ultimately pays off is the question investors will be watching as the debt comes due.
Last updated: July 24, 2026
Visual breakdowns and margin trends from recent public company SEC filings.
Norwegian Cruise Line Q3 2026: Higher Net Income Masks Weaker Operations
Oct 30, 2026
Read
Citizens Financial Group (CFG) Q3 2026: NII Expansion & Margin Growth
Oct 30, 2026
Read
Chubb Limited Q3 2026 10-Q Analysis: 84.1% Combined Ratio & $1.79B Investment Income
Oct 30, 2026
Read
MGM Resorts Q3 2026: Operating Profit Rebounds as Adjusted EBITDA Falls 20.4%
Oct 30, 2026
Read