Loading blog posts...
August 6, 2026 • 4 min read
Seagate's fiscal 2026 was the kind of year hard drive investors have waited a decade for. The Ireland-domiciled, Singapore-headquartered maker of hard disk drives (HDDs) — the spinning-platter storage that still holds the overwhelming majority of the world's cloud data, competing chiefly with Western Digital and Toshiba — rode AI-driven data center buildouts to record profitability. Let's dig into the income statement in the FY2026 annual report to see where the money actually came from.
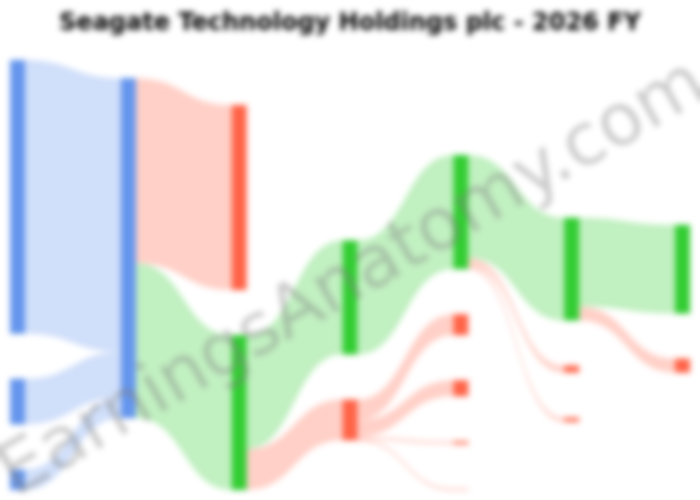
The headline: revenue of $12.20 billion, up 34% from $9.10 billion, with net income more than doubling to $3.18 billion and diluted EPS jumping to $13.90 from $6.77.
Because Seagate runs as a single reportable segment, cost of revenue and operating expenses aren't split across the OEM, distributor and retail channels shown feeding into revenue — the channels tell you who buys, not what each costs to serve. OEMs (mostly hyperscale cloud providers and server makers) contributed $9.82 billion, or 81% of sales, up 35%. Distributors grew fastest at +55% to $1.64 billion, while retail — consumer external drives — actually shrank 2% to $738 million. Data center is now 80% of revenue, up from 75%.
Seagate shipped 789 exabytes of HDD capacity, up 33%, with nearline (high-capacity cloud drives) up 40% to 695 EB while non-nearline slipped to 94 EB. Revenue grew almost exactly in line with capacity shipped — meaning average revenue per exabyte was roughly flat.
So where did the margin come from? Cost. Cost of revenue rose just 13% ($5.90B → $6.64B) against 33% more capacity shipped, implying cost per exabyte fell roughly 15%. That's the payoff from Seagate's HAMR (heat-assisted magnetic recording) Mozaic platform, which packs more terabytes onto each platter, combined with a factory footprint running full. Gross margin leapt from 35% to 46%, and operating margin from 21% to 34%. Operating expenses grew only 12%, with R&D ("product development") up just 4% to $755 million — classic fixed-cost leverage.
Inventory composition backs up the tight-supply narrative: work-in-process climbed to $1.09 billion while finished goods fell to $176 million. Drives aren't sitting around.
Three items dented the bottom line:
Cash generation was extraordinary: $3.67 billion from operations versus $1.08 billion, funding $569 million of capex (more than double last year), $634 million of dividends and $176 million of buybacks. Shareholders' equity flipped from a $453 million deficit to positive $2.17 billion, helped by partial conversion of the 3.50% exchangeable notes, which added 13 million shares. Note the remaining $186 million of those notes carry a fair value of $1.91 billion — a measure of how far the stock has run (the filing's performance graph shows a $100 investment in July 2021 worth $1,094 by July 2026).
Seagate enters FY2027 with pricing power it hasn't had in years, but the risk factors are a reminder of the cyclicality baked into this industry: customer concentration, seasonal consumer weakness, tariffs and trade policy across its China, Malaysia, Thailand and Singapore plants, and a high fixed-cost base that cuts both ways. With Western Digital pursuing the same HAMR-era capacity race and NAND flash slowly encroaching on some workloads, the durability of 46% gross margins — not the growth rate — is the number to track.
Last updated: August 6, 2026
Explore prior quarterly filings, historical revenue breakdowns, and earnings trends.
Seagate Q1 FY2027: Higher Pricing Drives Profit Surge and Debt Reduction
Oct 30, 2026
Read
Seagate (STX) Q3 2026: Surging Demand Drives $3.11B Revenue
Apr 30, 2026
Read
Seagate Q2 2026: Data Center Demand Drives Margin Expansion
Jan 31, 2026
Read
Seagate's 2025 10-K: Mass Capacity Pivot Drives Record Profitability
Aug 3, 2025
Read