Loading blog posts...
July 29, 2026 • 3 min read
Ryder System, Inc. is a major North American logistics and transportation company specializing in fleet management, dedicated transportation, and supply chain solutions. The goal here is to dig into Ryder’s income statement from its latest 10-Q filing, unpack how the business is performing, and extract key insights about demand, operating margins, and capital discipline.
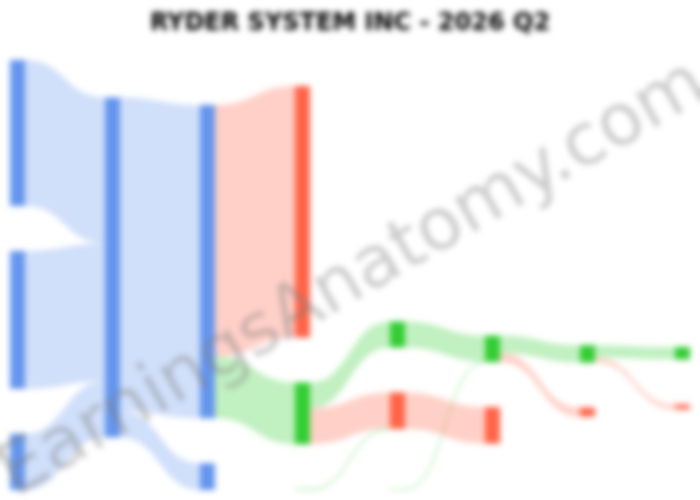
For Q2 2026, Ryder generated total revenue of $3.35 billion, a 5% increase from $3.19 billion in Q2 2025. Management also tracks "operating revenue"—a non-GAAP measure that excludes lower-margin subcontracted transportation and fuel pass-through revenues—which grew 3% to $2.69 billion.
Ryder operates a high-volume, capital-intensive model with modest margins:
While net earnings rose modestly from $131 million, diluted EPS grew faster due to share repurchases, which reduced diluted weighted-average shares to 38.9 million from 41.8 million.
The consolidated top-line includes $285 million in intercompany eliminations, representing internal service transactions between segments—primarily Fleet Management providing vehicles and maintenance to Supply Chain and Dedicated Transportation operations—that are removed to reflect net third-party revenue.
Performance varied noticeably across Ryder's primary business divisions:
The cash flow statement highlights management's disciplined capital allocation. For the first six months of 2026, operating cash flow was $1.26 billion (down from $1.40 billion), but free cash flow increased 48% to $684 million as capital expenditures dropped to $812 million from $1.19 billion.
This strong cash generation supported shareholder returns, including $332 million in share repurchases and $74 million in cash dividends during the first half. Total debt stood at $7.46 billion with a debt-to-equity ratio of 259%. Total liquidity remained strong at $1.08 billion, supported by credit and receivables facilities, while Moody’s upgraded Ryder's long-term rating to Baa1 in April 2026.
Ryder’s Q2 results highlight operational resilience led by fleet efficiency, commercial rental utilization, and used-vehicle pricing gains in Fleet Management. While Supply Chain volume expansion shows healthy customer demand, margin compression in that segment remains an area to watch in a competitive third-party logistics environment. Overall, disciplined capital spending and ongoing share repurchases continue to drive per-share value creation.
Last updated: July 29, 2026
Visual breakdowns and margin trends from recent public company SEC filings.
Norwegian Cruise Line Q3 2026: Higher Net Income Masks Weaker Operations
Oct 30, 2026
Read
Citizens Financial Group (CFG) Q3 2026: NII Expansion & Margin Growth
Oct 30, 2026
Read
Chubb Limited Q3 2026 10-Q Analysis: 84.1% Combined Ratio & $1.79B Investment Income
Oct 30, 2026
Read
MGM Resorts Q3 2026: Operating Profit Rebounds as Adjusted EBITDA Falls 20.4%
Oct 30, 2026
Read