Loading blog posts...
April 25, 2026 • 3 min read
Procter & Gamble (P&G) is a titan of the global consumer goods sector, boasting an immense portfolio of household staples like Tide, Pampers, Gillette, and Crest. Because consumers generally prioritize basic hygiene and household chores regardless of macroeconomic swings, P&G typically enjoys a defensive edge in the market. Let's dig into the income statement from its latest quarterly report filed with the SEC to see how the company performed for the quarter ended March 31, 2026, and what that might signal about current consumer behavior.
For the third quarter of its fiscal year, P&G reported net sales of $21.2 billion, a solid 7% increase compared to the same period last year. Net earnings attributable to the company also rose by 4% to $3.9 billion.
Interestingly, this top-line growth wasn't just about higher prices. The increase in sales was driven by a healthy combination of factors: a 2% increase in sales volume, a 1% bump from favorable pricing, and a significant 4% tailwind from foreign exchange rates. This suggests that despite a challenging economic environment, consumer demand for P&G's products remains robust.
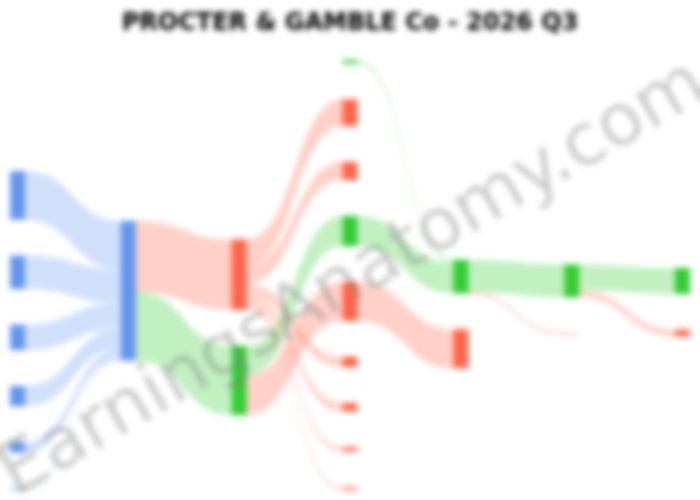
To visualize how the company's revenue flows through its costs and expenses to the bottom line, the following diagram breaks down the quarterly income statement.
The flow diagram visualizes how revenue is converted into profit. The "Corporate" category, which isn't one of the main business segments, includes revenues and costs not allocated to the five primary divisions. For this quarter, it accounted for approximately $225 million in sales and $406 million in costs.
Growth was broad-based across all of P&G's business segments, pointing to widespread strength.
Despite the strong sales figures, P&G's profitability faced some pressure. Gross margin decreased by 150 basis points (1.5%) to 49.5%. According to the filing, this squeeze was primarily caused by an unfavorable product mix, higher costs from tariffs, and restructuring charges.
However, the company managed to offset some of these pressures through significant manufacturing productivity savings, which contributed 210 basis points (2.1%) to the margin. This highlights P&G's operational efficiency in a tough cost environment.
In conclusion, P&G's Q3 2026 performance demonstrates resilient consumer demand, with growth impressively fueled by higher sales volume, not just price hikes. Yet, the decline in gross margin shows that the company is still navigating challenges from shifting consumer purchasing patterns and external cost pressures. While P&G's ability to grow volume is a strong positive signal, its ongoing focus on productivity and cost management will be crucial to protecting its bottom line moving forward.
Last updated: April 25, 2026
Explore prior quarterly filings, historical revenue breakdowns, and earnings trends.
Procter & Gamble Q1 FY2027: Sales Rise 4% as Higher Costs Squeeze Margins
Oct 22, 2026
Read
Procter & Gamble 2026 10-K Analysis: Top-Line Growth Meets Margin Squeeze
Aug 5, 2026
Read
Procter & Gamble Q2 Earnings: Rising Costs Squeeze Margins
Jan 24, 2026
Read
P&G's Q1 2026 10-Q: The Story Behind a 20% Earnings Jump
Oct 25, 2025
Read