Loading blog posts...
April 29, 2026 • 3 min read
Microsoft continues to operate as an absolute titan in the tech industry, defying the laws of large numbers. In their latest 10-Q filing for the quarter ended March 31, 2026 (fiscal Q3), the software giant posted an impressive $82.9 billion in total revenue, up 18% from the same period last year. This robust growth translated to an even stronger bottom line, with net income surging 23% to $31.8 billion, resulting in a diluted earnings per share (EPS) of $4.27. Let's unpack the income statement to see how the Redmond-based company is achieving these massive figures and where its strategic bets are paying off.
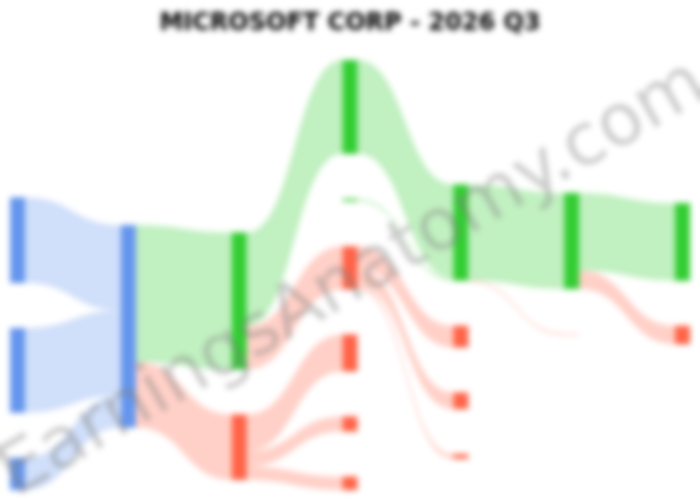
To help visualize where this money is coming from and where it goes—from top-line revenue down to the bottom line—the following flow diagram provides a breakdown of the quarterly results.
The filing clearly shows that Microsoft's future is firmly rooted in the cloud. The Intelligent Cloud segment was the standout performer, with revenue climbing 30% year-over-year to $34.7 billion. This segment, which includes the critical Azure platform, now represents the largest portion of Microsoft's revenue. However, this growth comes at a cost; the cost of revenue for this segment jumped by 47%. This signals significant investment in the underlying infrastructure, such as datacenters and servers, needed to meet the voracious demand for cloud computing and AI services.
The Productivity and Business Processes segment also posted strong results, with revenue growing 17% to $35.0 billion. This division includes the Microsoft 365 software suite, LinkedIn, and Dynamics 365. LinkedIn revenue grew a healthy 12%, while Dynamics 365 revenue was up 22%, indicating continued momentum in its enterprise application business.
Meanwhile, the More Personal Computing segment, which includes Windows and Xbox, saw revenue dip slightly by 1% to $13.2 billion, reflecting the mature nature of the PC market.
Microsoft's spending patterns underscore its strategic priorities. Research and development (R&D) expenses increased by 9% to $8.9 billion, driven by what the company describes as "continued investments in compute capacity, AI talent, and data." This is the tangible cost of building and maintaining a lead in the artificial intelligence race.
Similarly, sales and marketing expenses rose 10% to $6.8 billion, which the report attributes primarily to "higher Copilot advertising expenses." This highlights Microsoft's aggressive push to monetize its AI-powered productivity tools and embed them within its ecosystem.
The company's investment in OpenAI also continues to be a noteworthy factor in its financial results. For the nine months ending March 31, 2026, Microsoft recorded a substantial $5.9 billion net gain related to its OpenAI investment, primarily from a dilution gain during a recapitalization event.
In conclusion, Microsoft's Q3 results paint a picture of a company successfully firing on its most important strategic cylinders. The immense growth in the Intelligent Cloud segment, fueled by Azure and AI demand, is more than compensating for the stagnation in the personal computing market. While the investments in infrastructure and marketing are substantial, they appear to be crucial and effective bets on the future of enterprise technology.
Last updated: April 29, 2026
Explore prior quarterly filings, historical revenue breakdowns, and earnings trends.
Inside Microsoft's Q1 FY2027 10-Q: Azure Surge and the $365B AI Infrastructure Bet
Oct 28, 2026
Read
Microsoft FY2026: $331.8B Revenue, $133.7B Net Income — and an AI Depreciation Wave
Jul 31, 2026
Read
Microsoft Q2 2026: Deconstructing the OpenAI Boost and AI Costs
Jan 28, 2026
Read
Microsoft Q1 FY26: Cloud Growth Fuels Revenue as AI Costs Hit Bottom Line
Oct 30, 2025
Read