Loading blog posts...
August 2, 2026 • 4 min read
Hilton Grand Vacations sells timeshares — or, in industry parlance, "vacation ownership intervals" (VOIs) — under the Hilton brand, and then earns recurring money managing the resorts, running the points club, renting unsold inventory, and financing the loans it makes to buyers. After absorbing Diamond Resorts in 2021 and Bluegreen Vacations in 2024, HGV sits alongside Marriott Vacations Worldwide and Travel + Leisure Co. as one of the three giants of the space. Let's dig into the Q2 2026 10-Q to see how the machine is running.
The headline is a split screen: revenue up 7.3% to $1.36 billion, but net income down 46% to $15 million, with EPS of $0.15 versus $0.26 a year ago.
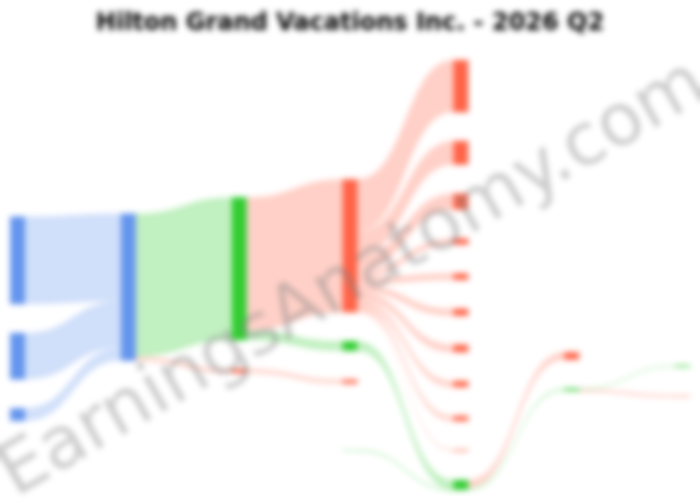
The $119 million of "unallocated" revenue in the diagram isn't a mystery item — it's $150 million of cost reimbursements (money HGV collects from homeowners' associations to cover costs it incurs on their behalf, booked as an identical offsetting expense) netted against $31 million of intersegment eliminations. It flows through at exactly zero margin.
The most important number in this filing isn't on the income statement. Contract sales — the gross value of timeshare contracts signed, and the truest leading indicator for this business — fell 2.9% to $810 million even as GAAP revenue rose. The mechanics: tour flow (sales presentations given) climbed 6.1% to 239,064, but volume per guest (VPG) dropped 8.6% to $3,372. HGV is putting more bodies in the room and converting them at materially lower value.
So why did revenue rise? Two accounting-driven reasons. First, construction deferrals shrank — HGV must defer revenue on VOIs sold in buildings still under construction, and the drag was $54 million this quarter versus $82 million last year. Second, the mix shifted away from fee-for-service (selling third-party developers' inventory for a commission, which books only the fee) toward owned inventory (which books the full sale price). Fee-for-service commissions fell 24% to $64 million. Real estate profit margin still improved smartly, to 25.4% from 21.2%.
HGV finances most of its buyers, and the financing segment is genuinely profitable — a 59.7% profit margin on $144 million of revenue. But the provision for financing receivables losses jumped 28% to $122 million in the quarter ($211 million year-to-date). Against roughly $706 million of owned contract sales, that's a ~17% loss provision, up from ~14% a year ago. Weighted-average FICO slipped to 747 from 751, and gross receivables 121+ days past due grew to $698 million from $542 million at year-end — about 14% of the $4.98 billion gross book. The receivables balance itself ballooned to $3.59 billion net, partly from the Elara deal.
Two items explain most of the profit drop. A $48 million loss on sale and impairment (versus $1 million last year) landed in the quarter, and D&A rose $12 million to $71 million. Working the other way: interest expense fell to $70 million from $79 million, and buybacks did heavy lifting — HGV repurchased 6 million shares for $300 million in the first half, cutting weighted-average diluted shares from 92.2 million to 80.9 million. Adjusted EBITDA still grew 13% to $269 million, though that missed Street expectations near $291 million.
The May acquisition of the remaining 75% of Elara on the Las Vegas Strip (from a Blackstone affiliate) added $411 million of receivables and $310 million of non-recourse debt, and is why equity in earnings from affiliates fell to $2 million. Post-quarter, HGV refinanced its 2028 Term Loan B into an $850 million facility due 2033.
Management reiterated full-year adjusted EBITDA guidance of $1.225–$1.265 billion, and operating cash flow more than doubled to $262 million. But with $7.9 billion of total debt against $1.26 billion of equity, softening VPG, and rising loan provisions, HGV is leaning on tour volume and buybacks to offset per-customer weakness. In a category where Marriott Vacations and Travel + Leisure face the same consumer, the question for the back half of 2026 is whether VPG stabilizes — or whether more tours at lower yields becomes the new normal.
Last updated: August 2, 2026
Explore prior quarterly filings, historical revenue breakdowns, and earnings trends.
Visual breakdowns and margin trends from recent public company SEC filings.