Loading blog posts...
October 23, 2026 • 4 min read
Oil and gas prices surged in the third quarter of 2026—with West Texas Intermediate (WTI) crude averaging $87.22 per barrel compared to $65.74 a year ago—yet the domestic oilfield services landscape remains surprisingly nuanced. To see how one of the world’s premier energy service providers is navigating these cross-currents, we can dig into the income statement from Halliburton Company’s latest 10-Q filing and examine what its financial performance reveals about the state of global energy production.
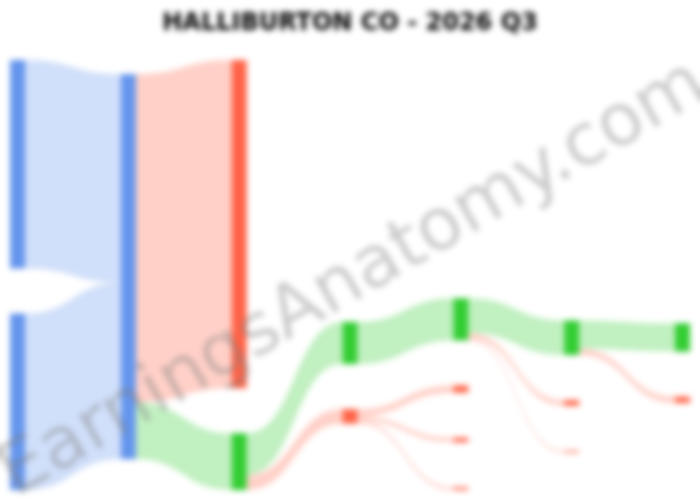
Halliburton, which operates in over 70 countries alongside major rivals like SLB and Baker Hughes, generated $5.70 billion in total revenue for the three months ended September 30, 2026, a modest 2% increase year-over-year. However, the bottom line showed a much more dramatic swing: GAAP net income rose to $419 million ($417 million attributable to the company, or $0.50 per diluted share), up sharply from just $20 million ($0.02 per share) in Q3 2025.
A closer look at Halliburton's two operating divisions highlights a clear geographic divergence between North American land operations and international markets:
Geographically, North America revenue dropped 9% year-over-year to $2.16 billion. Meanwhile, international regions picked up the slack: Europe/Africa/CIS surged 23% to $1.02 billion and Latin America grew 13% to $1.12 billion, while Middle East/Asia held steady at $1.41 billion as activity continued to recover from geopolitical disruptions despite regional cost inflation.
Halliburton’s total operating costs and expenses decreased from $5.24 billion in Q3 2025 to $5.08 billion in Q3 2026, boosting total operating income by 75% to $624 million (a 10.9% operating margin). Direct cost of revenue (combining $3.59 billion in cost of services and $1.27 billion in cost of product sales) totaled $4.86 billion, leaving a gross profit of $840 million (a 14.7% gross margin).
Below the gross profit line, operating expenses totaled $216 million. This included $67 million in general and administrative expenses, $42 million for Halliburton's ongoing migration to its SAP S4 enterprise resource planning system, and $107 million in net impairments and other charges (down from $392 million a year ago).
Digging into that $107 million net charge reveals two notable operational adjustments:
Additionally, a normalized effective tax rate of 18.3% ($94 million tax provision on $513 million of pre-tax income)—compared to an unusually high 90.9% rate in Q3 2025—helped translate operating gains directly into net profit.
Halliburton continues to convert its steady earnings into shareholder returns. Through the first nine months of 2026, the company generated $1.47 billion in operating cash flow, easily funding $693 million in capital expenditures. In the third quarter alone, management repurchased 7.3 million shares for $252 million and paid $141 million in dividends ($0.17 per share).
As Halliburton competes head-to-head with SLB and Baker Hughes, its Q3 2026 income statement demonstrates the resilience of a globally diversified model. By trimming overhead, modernizing its ERP systems, and leaning into international drilling and data-center-driven energy demand, Halliburton is keeping margins on solid footing even while North American completion markets take a breather.
Last updated: October 23, 2026
Explore prior quarterly filings, historical revenue breakdowns, and earnings trends.
Halliburton Q2 2026: Revenue Growth Masked by Nonrecurring Credits
Jul 25, 2026
Read
Halliburton Q1 2026 10-Q Analysis: Margin Expansion & Regional Shifts
Apr 25, 2026
Read
HAL 2025 10-K: Profit Squeeze, Impairments, and the International Pivot
Feb 8, 2026
Read
Halliburton Q2 2025 Results: Navigating Market Headwinds
Jul 28, 2025
Read