Loading blog posts...
July 25, 2026 • 4 min read
Halliburton is one of the world’s largest oilfield services companies, providing drilling, completion, production, and reservoir-related services to oil and gas producers in more than 70 countries. The goal here is to dig into the income statement from Halliburton’s Q2 2026 Form 10-Q and see how the business is performing beneath the headline earnings number — especially because oil prices were much stronger, while activity levels were mixed.
For the quarter ended June 30, 2026, Halliburton reported total revenue of $5.7 billion, up 4% from $5.5 billion a year earlier. Net income attributable to the company rose to $534 million, or $0.64 per diluted share, compared with $472 million, or $0.55 per share, in Q2 2025.
At first glance, that looks like a solid quarter. But the income statement shows a more nuanced picture: segment operating income actually fell slightly, from $825 million to $812 million. Reported operating income improved to $778 million, up 7%, largely because Halliburton recorded a $95 million pre-tax credit in “impairments and other charges (credits).”
That credit included a $64 million gain on investments, including a $54 million gain tied to changes in ownership interest in an equity investment and a $10 million fair-value remeasurement gain. The filing does not identify the underlying investment. Halliburton also recorded $48 million of other credits, primarily from a government refund recovery, partly offset by a $17 million loss on the sale of a portion of its chemical business.
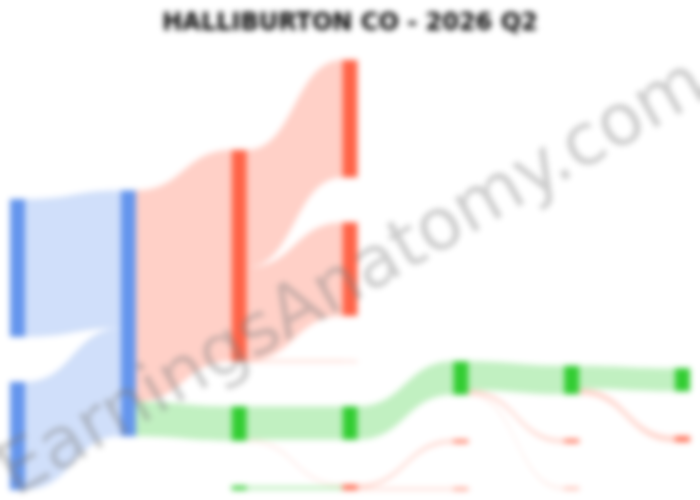
Here is the quarterly income statement flow:
The flow includes a small $8 million unallocated cost of revenue, described as the difference between total company cost of revenue and total segment operating expenses — not a major driver, but useful context when reconciling segment costs to consolidated results.
Halliburton reports two operating segments:
Completion and Production remained the larger business, generating $3.2 billion, or 56% of total revenue. However, its operating income fell 8% to $474 million, even though revenue was essentially flat. The segment margin declined to 14.8%, pressured by activity mix and lower pricing for stimulation services in U.S. land and Latin America.
Drilling and Evaluation performed better. Revenue rose 7% to $2.5 billion, and operating income increased 8% to $338 million, producing a 13.5% operating margin. Halliburton cited stronger drilling-related services in North America, Europe/Africa, and Asia, along with broader activity gains in Latin America.
The implication: Halliburton’s growth is not simply broad-based pricing power. It is more dependent on mix, geography, and which service lines are gaining traction.
Regionally, the standout areas were Europe/Africa/CIS, up 24% to $1.0 billion, and Latin America, up 15% to $1.1 billion. North America was nearly flat at $2.3 billion.
The weak spot was Middle East/Asia, where revenue fell 11% to $1.3 billion. Halliburton said geopolitical conflict in the Middle East affected both operating segments, with recent company commentary pointing to lower activity in countries including Kuwait, Iraq, and Qatar.
That regional softness matters because international growth has been an important support for oilfield service companies. Halliburton’s peers, including SLB and Baker Hughes, are also highly exposed to global upstream spending cycles.
For the first six months of 2026, Halliburton generated $1.1 billion of operating cash flow, down from $1.3 billion a year earlier, despite higher net income. The difference was largely working capital: receivables increased by $429 million, while inventories also rose.
Capital expenditures fell sharply to $427 million for the first half, versus $656 million last year. Halliburton also returned cash to shareholders, repurchasing $308 million of stock and paying $285 million in dividends during the first six months. In Q2 alone, it bought back about 5.0 million shares for $201 million, with $1.7 billion remaining under its authorization.
Halliburton delivered higher revenue and EPS, but the quarter was helped by non-recurring credits, while core segment operating income slipped slightly. The most encouraging signs came from Drilling and Evaluation and from Latin America and Europe/Africa/CIS. The biggest pressure points were Middle East disruptions and weaker margins in Completion and Production.
In a market where Q2 WTI averaged $95.75 and Brent averaged $103.28, the muted rig count response is notable. Strong oil prices are helpful, but Halliburton’s results show that customer spending, geopolitics, and service-line pricing still determine how much of that macro strength reaches the income statement.
Last updated: July 25, 2026
Visual breakdowns and margin trends from recent public company SEC filings.
Norwegian Cruise Line Q3 2026: Higher Net Income Masks Weaker Operations
Oct 30, 2026
Read
Citizens Financial Group (CFG) Q3 2026: NII Expansion & Margin Growth
Oct 30, 2026
Read
Chubb Limited Q3 2026 10-Q Analysis: 84.1% Combined Ratio & $1.79B Investment Income
Oct 30, 2026
Read
MGM Resorts Q3 2026: Operating Profit Rebounds as Adjusted EBITDA Falls 20.4%
Oct 30, 2026
Read