Loading blog posts...
October 23, 2026 • 3 min read
Digging into quarterly income statements offers a valuable window into how cyclical manufacturing heavyweights manage volatile input costs, shifting demand, and pricing dynamics. Materials science giant Dow Inc. recently released its third-quarter 10-Q filing, revealing a marked operational rebound compared to the same period last year. The goal today is to unpack Dow’s income statement to examine how profitability is tracking, evaluate segment performance, and extract key insights from the numbers.
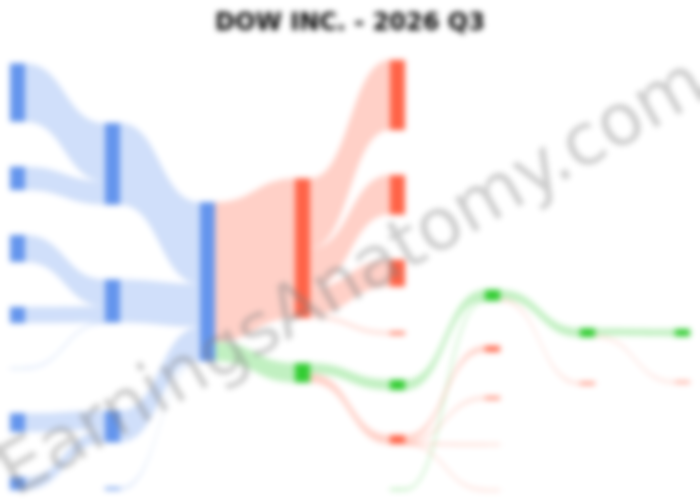
In the visual breakdown above, corporate net trade sales of $181 million appear alongside unallocated cost of sales of $210 million. These entries represent corporate-level activities, specialized shared services, and inventory adjustments that fall outside the purview of the three primary operating divisions, resulting in a modest operational cost drag at the consolidated level.
Dow generated total net sales of $11.3 billion for the quarter, an increase of 13% compared to $9.97 billion in the third quarter of 2025. This expansion was spearheaded almost entirely by local prices and product mix, which surged 14% across the portfolio, while overall sales volume contracted 1% and currency effects were neutral.
Performance across Dow’s three core reporting divisions showcased varying momentum:
The top-line pricing strength delivered considerable operating leverage. Gross profit expanded to $1.38 billion, while operating income climbed to $741 million—a sharp increase from prior-year operating income.
Below the operating line, sundry income contributed $50 million, supported by a $69 million legal gain relating to an ongoing Nova Chemicals ethylene asset dispute, which offset a $53 million loss on the early extinguishment of long-term debt. Dow closed the quarter with consolidated net income of $525 million, yielding diluted earnings per common share (EPS) of $0.62, up sharply from $0.08 in the third quarter of 2025.
Dow’s operational resurgence is equally evident in its cash generation. For the first nine months of the year, operating cash flow from continuing operations jumped to $4.29 billion, up from $764 million in the prior-year period. This supported $1.84 billion in capital investments while generating $2.45 billion in Free Cash Flow (a non-GAAP metric representing operating cash flow less capital expenditures).
Dow continues to navigate structural challenges in chemical manufacturing, including elevated global capacity additions and fluctuating feedstocks that impact peers such as BASF and LyondellBasell. Through active cost-efficiency programs like its Transform to Outperform initiative, Dow's disciplined pricing and cash generation demonstrate solid resilience in a cautious global operating environment.
Last updated: October 23, 2026
Explore prior quarterly filings, historical revenue breakdowns, and earnings trends.
Dow Inc. Q2 2026 Earnings: Pricing Power Drives $802M Net Income
Jul 28, 2026
Read
Dow Inc. Q1 2026 10-Q Analysis: Navigating a Cyclical Downturn
Apr 25, 2026
Read
Dow Inc. Swings to $2.44B Loss: Restructuring, Impairments, and Dividend Cuts
Feb 4, 2026
Read
Dow Q3 2025: Sales Slump and Squeezed Margins Prompt Restructuring
Oct 27, 2025
Read