Loading blog posts...
October 12, 2026 • 4 min read
Costco closed its fiscal 2026 on August 30 with a milestone: total revenue crossed $300 billion for the first time. The annual 10-K gives us a chance to dig into the income statement and see where that growth actually came from — and why a company that earns a razor-thin margin on merchandise keeps compounding profits at a double-digit clip.
The headline figures: total revenue of $303.2 billion, up 10.1%, operating income of $11.7 billion (+12.5%), and net income of $9.23 billion, or $20.76 per diluted share, up 13.9% from $18.21 last year.
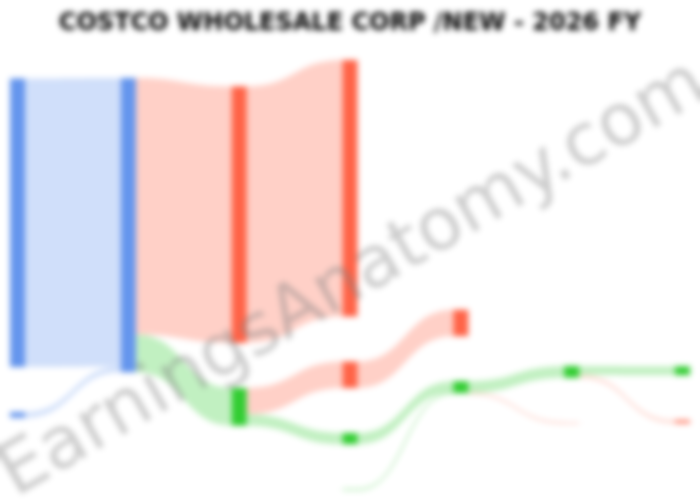
The flow diagram makes Costco's business model unusually legible. Of $303.2 billion in revenue, $297.2 billion is merchandise sales — and $264.3 billion of that goes straight back out as merchandise costs. What's left over on goods is $33.0 billion, an 11.09% merchandise gross margin, essentially flat versus 11.12% last year (management notes it would have risen 10 basis points excluding gasoline price inflation, which inflates the sales denominator).
Then there's the other revenue line: membership fees of $5.9 billion, up 11%, which carry essentially no direct cost. That 1.9% sliver of revenue represents about 51% of Costco's $11.7 billion operating income. Paid members grew to 84.1 million from 81.0 million, and total cardholders reached 150.4 million. Average fee revenue per paid member climbed from roughly $65.70 to $70.20, reflecting last year's fee increase, Executive membership upgrades (the higher-priced tier that earns 2% cash back), and new sign-ups. Note also the $3.0 billion of deferred membership fees on the balance sheet — cash collected but not yet recognized, a nice working-capital feature.
The quietly impressive line is SG&A: $27.2 billion, or 9.15% of net sales, down from 9.25%. Expenses grew 8.9% while sales grew 10.1%. Gasoline inflation flatters that ratio too (excluding it, SG&A ratio ticked up 1 bp), but the result is real: operating income grew faster than revenue.
Below the operating line, Costco is now meaningfully a beneficiary of its own cash pile. Interest income rose to $601 million from $469 million, against just $145 million of interest expense, as cash and equivalents swelled to $20.2 billion versus $6.2 billion of total debt. The effective tax rate dipped to 24.7% from 25.1%, helped by $134 million in research and development credits.
A few other details worth flagging:
Operating cash flow of $15.8 billion funded $6.4 billion of capital spending across a 939-warehouse fleet, with average sales per warehouse hitting $292 million versus $272 million a year ago. The risks are familiar but not trivial: heavy dependence on U.S. and Canadian operations, foreign-currency swings (which added $1.3 billion to sales this year and could reverse), and tariffs — Q4 included a one-time $0.15-per-share benefit from IEEPA tariff refunds, partly reinvested in member pricing.
Against Walmart's Sam's Club and BJ's Wholesale, Costco's edge remains the same arithmetic: sell goods at near cost, keep expenses lean, and let renewal-driven membership fees do the profit work. As long as the member count keeps climbing, the model keeps paying.
Last updated: October 12, 2026
Explore prior quarterly filings, historical revenue breakdowns, and earnings trends.
Costco Q3 2026 Financial Analysis: Unpacking the Latest 10-Q Filing
Jun 4, 2026
Read
Costco Q2 2026 Earnings Analysis: Margin Magic & Membership Fees
Mar 12, 2026
Read
Costco Q1 FY2026 Analysis: Membership Fees and Digital Growth
Dec 18, 2025
Read
Costco's 2025 10-K: Analyzing Strong Sales and Membership Growth
Oct 8, 2025
Read