Loading blog posts...
May 15, 2026 • 4 min read
When a global packaging juggernaut absorbs a massive competitor, the resulting financial statements offer a fascinating window into the realities of corporate integration. Amcor plc—a dominant force in producing flexible wrappers, rigid bottles, and specialized containers for everything from food and beverages to medical supplies—recently reported its fiscal Q3 2026 results. By unpacking the numbers from their latest 10-Q filing, we can see exactly how their $10.4 billion mega-merger with Berry Global Group, completed in April 2025, is reshaping the company’s bottom line.
At first glance, the top-line growth is staggering. Amcor reported net sales of $5.9 billion for the quarter, a 77% increase from the $3.3 billion in the same period last year. This leap is almost entirely attributable to the integration of Berry Global's operations.
However, a look further down the income statement reveals the costs of this expansion. Operating income grew to $461 million, but the operating margin compressed from 9.4% to 7.8%. Net income attributable to Amcor plc rose to $278 million from $196 million a year ago, but as a percentage of the massively increased sales, profitability is tighter.
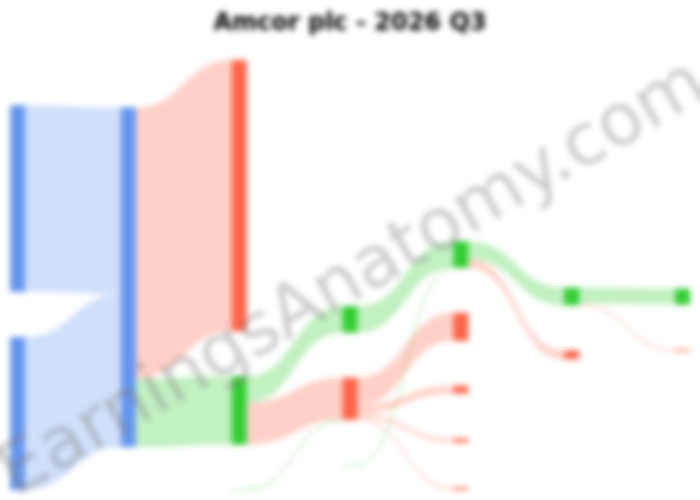
This flow diagram provides a visual breakdown of how Amcor's revenue for the third quarter translated into profit after accounting for all costs and expenses.
The higher revenue is a direct result of the merger, but so are the increased costs. Key expenses ballooned, including a doubling of interest expense to $170 million for the quarter due to merger-related debt, and a near-quadrupling of amortization charges for acquired intangible assets, which hit $134 million.
Amcor’s business is split into two primary segments, and the merger has impacted them differently.
Global Flexible Packaging Solutions: This segment, which produces packaging for snacks, coffee, and healthcare products, saw sales grow a respectable 35% to $3.25 billion. However, its adjusted EBIT (Earnings Before Interest and Taxes) margin saw a slight dip from 14.3% to 13.9%, indicating some pressure in its core business.
Global Rigid Packaging Solutions: This is where the Berry acquisition made its biggest splash. Sales nearly tripled, rocketing from $927 million to $2.7 billion. More impressively, the segment's adjusted EBIT margin expanded significantly from 7.6% to 10.4%. This suggests that the acquired assets are not only larger but are also contributing to higher profitability in the rigid packaging space, which includes containers for beverages and personal care products.
Merging two giants is a complex and expensive process. Amcor recorded $69 million in restructuring, transaction, and integration expenses for the quarter. These costs are part of the "Berry Plan," a major restructuring initiative aimed at achieving an estimated $400 million in annual pre-tax cost synergies. While these short-term costs are impacting current profits, they are a necessary investment to streamline the combined company.
In another strategic move, Amcor is actively refining its portfolio. The company has classified $503 million in assets as "held for sale," signaling its intent to divest non-core parts of the newly enlarged business. It also finalized the sale of its investment in ePac Holdings, a digitally-based flexible packaging firm, recognizing a pre-tax gain of $47 million.
Amcor's Q3 results paint a clear picture of a company in a transformative phase. The Berry Global merger has delivered on its promise of dramatically increased scale and has already boosted the profitability of the rigid packaging segment. However, the costs associated with the deal—higher debt service, amortization, and restructuring charges—are creating significant headwinds for the bottom line.
The success of this monumental merger now hinges on management's ability to execute the "Berry Plan" and realize the targeted cost savings. Investors and competitors alike will be watching closely to see if Amcor can effectively manage its higher debt load and translate its newfound market dominance into sustainable, long-term profit growth.
Last updated: May 15, 2026
Explore prior quarterly filings, historical revenue breakdowns, and earnings trends.