Loading blog posts...
March 6, 2026 • 3 min read
Agilent Technologies, a key player in the life sciences, diagnostics, and applied chemical markets, recently provided a detailed look into its financial health with its first-quarter 2026 Form 10-Q filing. The report reveals a narrative of solid top-line growth countered by mounting expenses that are squeezing profitability. Let's break down the numbers to understand what's happening under the hood.
For the quarter ending January 31, 2026, Agilent posted total net revenue of $1.8 billion, a respectable 7% increase from the $1.68 billion reported in the same period last year. This growth was broad-based, with revenue from products rising 6% and services climbing 9%.
However, this revenue growth didn't fully translate to the bottom line. Net income for the quarter was $305 million, a step down from the $318 million earned a year prior. This dip in profit is a direct result of costs growing faster than revenue. The company's operating margin, a key measure of profitability, compressed significantly, falling from 22.4% to 19.6%.
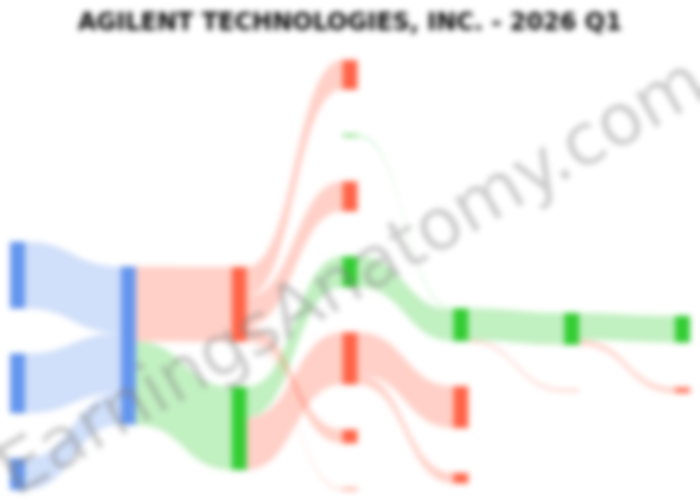
The following flow diagram provides a visual breakdown of how Agilent's $1.8 billion in revenue trickled down to its $305 million in net income for the quarter.
The primary culprit for the margin squeeze was a substantial 16% jump in Selling, General, and Administrative (SG&A) expenses, which ballooned to $476 million. Additionally, the company recorded $20 million in restructuring costs this quarter, compared to just $1 million in the prior year, further weighing on operating income.
Agilent's business is divided into three main segments, each with a distinct performance this quarter.
Agilent CrossLab: This segment, which provides services and consumables, was the star performer and is now the company's largest division by revenue. Its revenue grew by 9% to $758 million, and its operating income also rose a healthy 9% to $240 million. It maintained a robust operating margin of nearly 32%, proving to be the company's most profitable engine.
Applied Markets: Serving the chemical, energy, and advanced materials industries, this segment also posted strong results. Revenue increased by 7% to $361 million, while operating income grew an impressive 11% to $93 million. The segment even managed to expand its operating margin to 25.8%.
Life Sciences and Diagnostics Markets: This segment is where the challenges are most apparent. While revenue grew 5% to $679 million, its operating income fell by 7% to $109 million. The segment's operating margin contracted by two percentage points to 16.0%. Earnings call commentary pointed to softness in academia and government markets as a key factor impacting this division's performance.
Geographically, Agilent saw growth across the board, with particularly strong performance in Europe (up 12%) and Asia Pacific (up 10%).
Agilent's Q1 report presents a mixed picture. The company is successfully growing its revenue across most divisions and regions, demonstrating sustained demand for its instruments and services. However, the significant increase in operating costs, especially SG&A, and the margin deterioration in the Life Sciences and Diagnostics segment, are causes for concern.
Investors will be closely watching whether Agilent's management can rein in expenses and improve profitability in the coming quarters. The strong performance of the Agilent CrossLab and Applied Markets segments provides a solid foundation, but restoring the earnings power of the Life Sciences and Diagnostics division will be key to unlocking future value.
Last updated: March 6, 2026
Explore prior quarterly filings, historical revenue breakdowns, and earnings trends.
Agilent Q3 FY2026: Margins Jump to 55.5% as Biocare Deal Reshapes Diagnostics
Sep 2, 2026
Read
Agilent Q2 2026: 10% Revenue Growth and a 58% Profit Surge
Jun 2, 2026
Read
Agilent Technologies FY2025: Revenue Growth vs. Margin Compression
Dec 22, 2025
Read
Agilent Q3 2025: Revenue Climbs but Margins Tighten
Aug 30, 2025
Read