
Loading company details...
Explore prior quarterly filings, historical revenue breakdowns, and earnings trends.
eBay Q3 2026 10-Q Analysis: Depop Acquisition & Ad Growth Drive 14% Revenue Jump
Oct 30, 2026
Read
eBay Q1 2026 Financial Results: Strong Top-Line Growth Meets Margin Pressure
Apr 30, 2026
Read
eBay 2025 10-K Analysis: Advertising Pivot Drives Higher Take Rates
Feb 19, 2026
Read
eBay Q3 2025 Earnings: Ad Revenue Soars Amid Rising Costs
Oct 30, 2025
Read
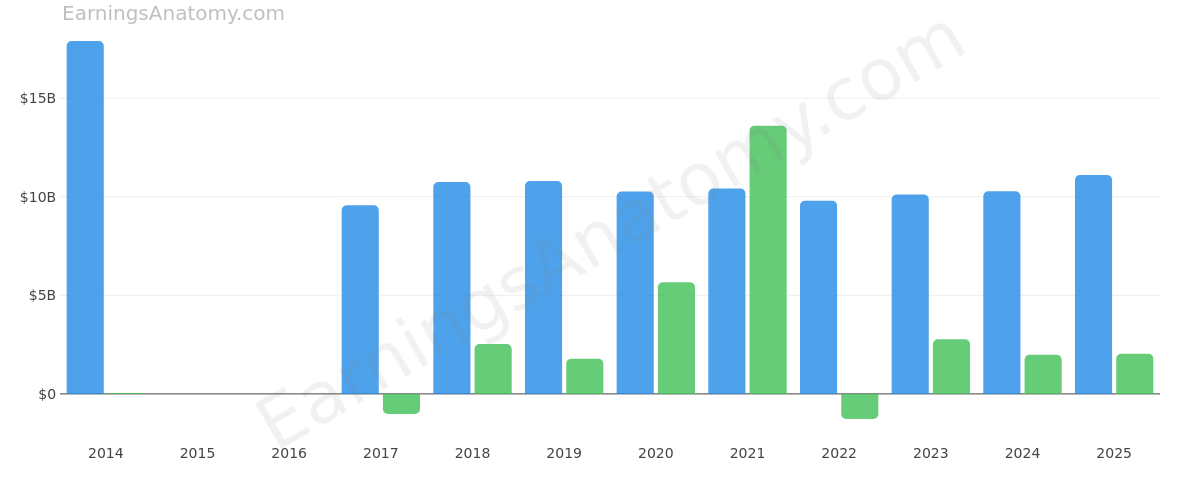
Loading interactive diagram…
Actions | Form 10-K 10-Q | Filing Date | Period | Analysis | Revenue | Net Income |
|---|---|---|---|---|---|---|
10-Q View Filing | Oct 29, 2026 | 2026 Q3 | Analysis | $3.21B | $497M | |
10-Q View Filing | Aug 6, 2026 | 2026 Q2 | - | $3.13B | $550M | |
10-Q View Filing | Apr 29, 2026 | 2026 Q1 | Analysis | $3.09B | $512M | |
10-K View Filing | Feb 19, 2026 | 2025 FY | Analysis | $11.1B | $2.03B | |
10-Q View Filing | Oct 30, 2025 | 2025 Q3 | Analysis | $2.82B | $632M | |
10-Q View Filing | Jul 31, 2025 | 2025 Q2 | Analysis | $2.73B | $368M | |
10-Q View Filing | May 1, 2025 | 2025 Q1 | - | $2.58B | $503M | |
10-K View Filing | Feb 27, 2025 | 2024 FY | - | $10.28B | $1.98B | |
10-Q View Filing | Oct 31, 2024 | 2024 Q3 | - | $2.58B | $634M | |
10-Q View Filing | Aug 1, 2024 | 2024 Q2 | - | $2.57B | $224M | |
10-Q View Filing | May 2, 2024 | 2024 Q1 | - | $2.56B | $439M | |
10-K View Filing | Feb 28, 2024 | 2023 FY | - | $10.11B | $2.77B | |
10-Q View Filing | Nov 8, 2023 | 2023 Q3 | - | $2.5B | $1.3B | |
10-Q View Filing | Jul 27, 2023 | 2023 Q2 | - | $2.54B | $171M | |
10-Q View Filing | Apr 27, 2023 | 2023 Q1 | - | $2.51B | $567M | |
10-K View Filing | Feb 23, 2023 | 2022 FY | - | $9.79B | -$1.27B | |
10-Q View Filing | Nov 3, 2022 | 2022 Q3 | - | $2.38B | -$69M | |
10-Q View Filing | Aug 4, 2022 | 2022 Q2 | - | $2.42B | -$531M | |
10-Q View Filing | May 5, 2022 | 2022 Q1 | - | $2.48B | -$1.34B | |
10-K View Filing | Feb 24, 2022 | 2021 FY | - | $10.42B | $13.61B | |
10-Q View Filing | Oct 28, 2021 | 2021 Q3 | - | $2.5B | $264M | |
10-Q View Filing | Aug 12, 2021 | 2021 Q2 | - | $2.67B | $10.73B | |
10-Q View Filing | Apr 29, 2021 | 2021 Q1 | - | $3.02B | $641M | |
10-K View Filing | Feb 4, 2021 | 2020 FY | - | $10.27B | $5.67B | |
10-Q View Filing | Oct 29, 2020 | - | - | - | - | |
10-Q View Filing | Jul 29, 2020 | - | - | - | - | |
10-Q View Filing | Apr 30, 2020 | - | - | - | - | |
10-K View Filing | Jan 31, 2020 | 2019 FY | - | $10.8B | $1.79B | |
10-Q View Filing | Oct 24, 2019 | - | - | - | - | |
10-Q View Filing | Jul 18, 2019 | - | - | - | - | |
10-Q View Filing | Apr 24, 2019 | - | - | - | - | |
10-K View Filing | Jan 30, 2019 | 2018 FY | - | $10.75B | $2.53B | |
10-Q View Filing | Oct 31, 2018 | - | - | - | - | |
10-Q View Filing | Jul 19, 2018 | - | - | - | - | |
10-Q View Filing | Apr 26, 2018 | - | - | - | - | |
10-K View Filing | Feb 5, 2018 | 2017 FY | - | $9.57B | -$1.02B | |
10-Q View Filing | Oct 20, 2017 | - | - | - | - | |
10-Q View Filing | Jul 21, 2017 | - | - | - | - | |
10-Q View Filing | Apr 20, 2017 | - | - | - | - | |
10-K View Filing | Feb 6, 2017 | - | - | - | - | |
10-Q View Filing | Oct 20, 2016 | - | - | - | - | |
10-Q View Filing | Jul 21, 2016 | - | - | - | - | |
10-Q View Filing | Apr 27, 2016 | - | - | - | - | |
10-K View Filing | Feb 1, 2016 | - | - | - | - | |
10-Q View Filing | Oct 28, 2015 | - | - | - | - | |
10-Q View Filing | Jul 21, 2015 | - | - | - | - | |
10-Q View Filing | Apr 23, 2015 | - | - | - | - | |
10-K View Filing | Feb 6, 2015 | 2014 FY | - | $17.9B | $46M | |
10-Q View Filing | Oct 16, 2014 | - | - | - | - | |
10-Q View Filing | Jul 18, 2014 | - | - | - | - |
Scroll for more