Loading blog posts...
July 29, 2026 • 4 min read
Digging into an SEC filing can reveal how much a company's financial performance is driven by broader commodity tailwinds versus internal operational execution. Newmont Corporation — one of the world's premier gold miners, with major operations spanning North America, Australia, Latin America, Africa, and Papua New Guinea — reported its Q2 2026 financial results, offering investors a clear look at the mechanics of a global producer operating in a high-metal-price environment. Let's unpack the numbers from their latest 10-Q filing to see how soaring metal prices, unit cost pressures, and strategic capital allocation shaped the quarter.
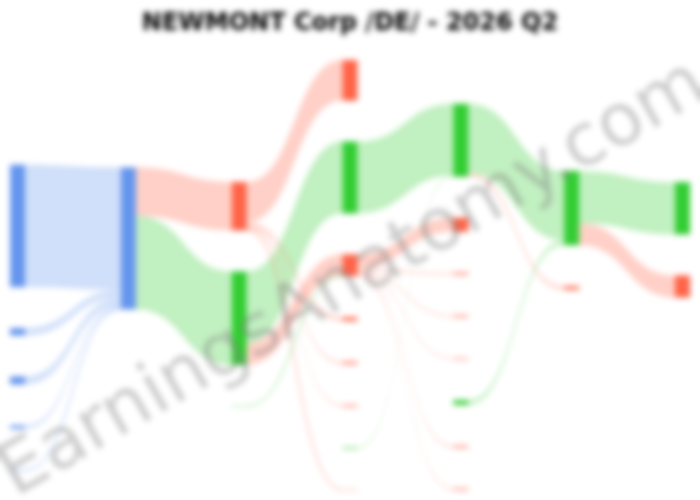
Newmont’s Q2 2026 sales reached $6.12 billion, up 15% from $5.32 billion in the prior-year quarter. While the top-line growth was substantial, price increases — rather than volume gains — carried the quarter.
Gold sales rose 15% to $5.28 billion, accounting for approximately 86% of total quarterly revenue. Consolidated gold sales volume fell to 1.195 million ounces (down from 1.380 million ounces in Q2 2025), but the average realized gold price surged 33% to $4,414 per ounce from $3,320 per ounce. Silver revenue also surged to $344 million (up from $191 million), aided by a realized silver price of $53.49 per ounce compared to $29.50 per ounce last year. Conversely, copper sales fell to $319 million from $360 million, as lower sales volumes offset a higher realized price of $6.82 per pound.
Newmont converted top-line revenue into strong profitability. Gross profit stood at $4.03 billion (65.9% gross margin), operating income reached $3.10 billion (50.6% operating margin), and net income attributable to Newmont stockholders was $2.20 billion (or $2.06 per diluted share).
However, underlying cost trends reflect industry-wide inflationary pressures. Total costs applicable to sales remained relatively flat at $2.09 billion, but lower production volumes drove unit costs higher. Gold costs applicable to sales rose to $1,463 per ounce, up from $1,215 per ounce in Q2 2025.
Similarly, All-In Sustaining Costs (AISC) — a standard mining industry metric that incorporates direct production costs alongside ongoing capital expenditures needed to maintain existing operations — rose to $1,938 per ounce from $1,593 per ounce. Operational disruptions contributed to these cost increases, including an April seismic event at Australia's Cadia mine that temporarily halted production before operations resumed in mid-June.
By geography, the primary Q2 revenue contributors were Australia at $1.50 billion, Nevada Gold Mines (a joint venture in the U.S.) at $1.07 billion, and Ghana at $721 million (supported by Ahafo North reaching commercial production in late 2025), followed closely by Mexico's Peñasquito at $663 million. The largest operational income contributors were Australia ($854 million), Nevada Gold Mines ($567 million), and Peru's Yanacocha ($382 million).
Portfolio activity was also notable: Newmont received a 13% equity stake in LunR Royalties Corp. (valued initially at $268 million) via a dividend-in-kind distribution from its equity-method investee, Lundin Gold.
On the cash flow front, operating cash flow for the first six months of 2026 reached $6.71 billion, generating $5.35 billion in free cash flow after $1.36 billion in capital expenditures. Newmont ended the quarter with $9.01 billion in cash and cash equivalents, total liquidity of $13.01 billion, and net cash of $3.41 billion. Management prioritized share buybacks, repurchasing $3.46 billion in common stock during H1 2026 (plus an additional $606 million post-quarter end), while maintaining a quarterly dividend of $0.26 per share.
Newmont’s Q2 earnings highlight a miner benefiting significantly from record precious metal prices, translating revenue growth into strong free cash generation and active share repurchases. However, rising unit costs and localized operational disruptions underscore the execution risks inherent in large-scale mining. As industry peers like Barrick Mining and Agnico Eagle face similar cost inflation and reserve replacement challenges, Newmont’s well-capitalized balance sheet, geographical diversification, and disciplined cash management provide strong defensive positioning.
Last updated: July 29, 2026
Explore prior quarterly filings, historical revenue breakdowns, and earnings trends.
Visual breakdowns and margin trends from recent public company SEC filings.