Loading blog posts...
April 28, 2026 • 3 min read
When you think of the insurance brokerage industry, it's easy to picture a slow, steady business. But a look under the hood of Brown & Brown, Inc. (BRO)—one of the largest insurance brokerages in the world—tells a completely different story. Between major acquisitions and a dramatic corporate talent war, their latest 10-Q filing is packed with action. Let's unpack the numbers from their Q1 2026 income statement to see how these major events are shaping their financial reality.
At first glance, Brown & Brown's growth is staggering. Total revenues for the first quarter of 2026 surged to $1.9 billion, a 35.4% increase from $1.4 billion in the same period last year. This growth was almost entirely driven by a 35.7% jump in their primary revenue source, "Commissions and fees."
However, the story changes when we look at organic growth—the growth generated from existing operations, excluding the impact of acquisitions and foreign currency translation. The filing reveals that the company's Organic Revenue growth rate was 0.0%. In fact, of the $495 million increase in commissions and fees, a whopping $435 million came from acquisitions made in the last year. This highlights a clear strategy: Brown & Brown is growing by buying, not necessarily by expanding its existing business lines.
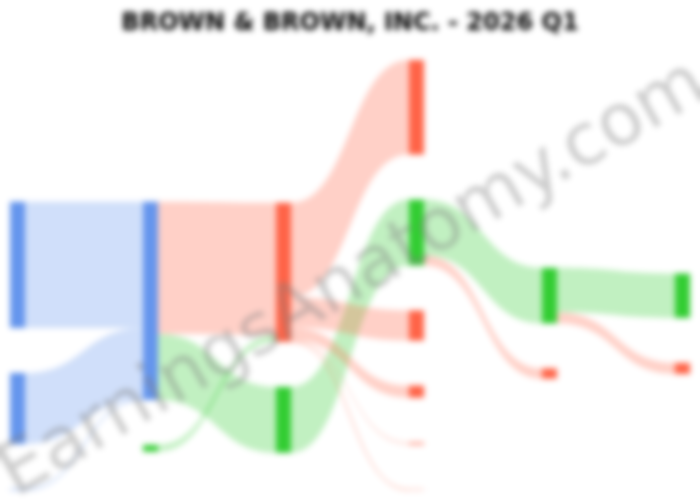
Here is a breakdown of how the company's $1.9 billion in quarterly revenue flows through expenses to its bottom-line net income.
While revenues soared, expenses kept pace. Employee compensation and benefits, the largest cost, rose 32.8% to $907 million. Other operating expenses jumped 55.4%, and interest expense more than doubled to $99 million, largely due to debt taken on for acquisitions.
An unusual item on the income statement is a $64 million gain from the "Mark-to-market of escrow liability." This non-cash gain stems from changes in the value of company shares held in an escrow account related to a past acquisition, providing a significant but artificial boost to pre-tax income.
Despite the revenue growth, the company's Income Before Income Taxes Margin actually compressed, falling from 30.4% in Q1 2025 to 28.0% in Q1 2026. This suggests that the newly acquired businesses may be less profitable or that integration costs are weighing on the bottom line. The company's adjusted profitability metric (EBITDAC Margin - Adjusted), which excludes acquisition-related costs, remained more stable at 38.5%, indicating the core business operations are holding steady.
Digging into the segment performance reveals further challenges.
Brown & Brown's Q1 2026 performance is a classic example of growth through acquisition. While the headline numbers look impressive, the flat-to-negative organic growth raises questions about the long-term sustainability of this strategy. The company is successfully consolidating a fragmented market, but it's also facing significant headwinds from integration costs, rising debt, and a fierce competitive landscape for talent. For investors, the key will be watching whether Brown & Brown can successfully integrate its new assets and reignite organic growth once the M&A engine cools.
Last updated: April 28, 2026
Explore prior quarterly filings, historical revenue breakdowns, and earnings trends.
Brown & Brown Q3 2026 10-Q: M&A Drives 7.4% Revenue Growth as Organic Pace Cools
Oct 30, 2026
Read
Brown & Brown Q2 2026: Acquisition Growth Meets Rising Interest Costs
Aug 2, 2026
Read
Brown & Brown (BRO) Q3 2025: Acquisitions Drive Revenue Growth Amid Profit Pressure
Oct 29, 2025
Read