Loading blog posts...
July 24, 2026 • 3 min read
American Airlines Group Inc. (AAL) recently dropped its Q2 2026 results, giving us a front-row seat to the current financial turbulence in the airline industry. As one of the world's largest legacy carriers, American operates in a highly competitive space alongside rivals like Delta Air Lines and United Airlines. Today, our goal is to dig into their income statement and see what we can learn about their financial trajectory in a dynamic travel market.
Let's unpack the numbers from their latest 10-Q filing to see how the company is balancing surging demand against soaring operating costs.
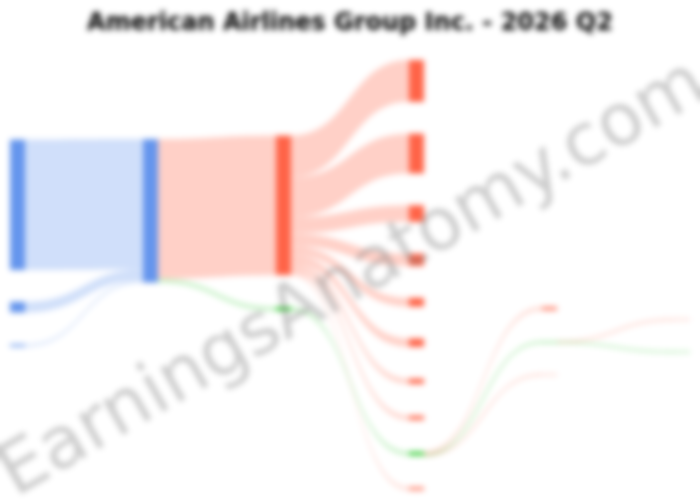
At first glance, American Airlines had a stellar quarter for sales. Total operating revenue climbed to $16.7 billion, representing a robust 16.3% increase compared to the $14.4 billion reported in Q2 2025. Passenger revenue was the primary growth engine, coming in at $15.2 billion (up 15.9% year-over-year).
The company also saw its TRASM (Total Revenue per Available Seat Mile)—a crucial airline industry metric measuring how much revenue is generated for every seat flown one mile—increase by 10.3% to 20.45 cents. Meanwhile, passenger yield (the average fare paid per mile by a passenger) jumped almost 12%. Clearly, people are still flying, and they are paying a premium to do so.
However, the bottom line tells a drastically different story. Net income plummeted a staggering 88%, dropping from $599 million in Q2 2025 to just $71 million this quarter. This translates to a razor-thin net profit margin of 0.4% and basic earnings per share (EPS) of just $0.11.
So, where did all that top-line revenue go? The culprit is practically singular: fuel costs.
In Q2 2026, aircraft fuel and related taxes consumed $4.9 billion of the company's revenue. That is an 83.3% spike compared to the $2.7 billion spent during the same period last year. Digging into the operating statistics, the average price per gallon of fuel skyrocketed from $2.29 to $4.05. Even though the airline only consumed 3.5% more fuel volume year-over-year, the macroeconomic shock of fuel prices single-handedly wiped out the impressive revenue gains.
Consequently, the airline's CASM (Cost per Available Seat Mile) surged to 19.90 cents, bringing it dangerously close to its 20.45-cent TRASM and leaving very little room for operating profit.
While core operations took a hit from fuel, the "Special Items" line in the income statement reveals some interesting non-operating action. American recorded an $18 million quarterly gain from mark-to-market adjustments on its equity investments.
For context, American Airlines holds strategic minority stakes in international carriers to expand its global footprint without operating direct routes. Notable investments include China Southern Airlines—China's largest carrier, which gives American a critical foothold in the Asian market—and JetSMART, a rapidly growing ultra-low-cost carrier that helps American capture market share across South America. These partnerships not only generate investment returns but also funnel international connecting traffic directly into American's domestic network.
American Airlines is currently generating massive revenue, proving that consumer demand for travel remains highly resilient. However, this quarter is a textbook example of the airline industry's vulnerability to commodity prices. With operating margins squeezed to just 2.7%, the airline will need to focus heavily on cost controls, modernizing its fleet, and optimizing routes as it battles for market share in the second half of the year.
Last updated: July 24, 2026
Explore prior quarterly filings, historical revenue breakdowns, and earnings trends.
Visual breakdowns and margin trends from recent public company SEC filings.