
Loading company details...
Explore prior quarterly filings, historical revenue breakdowns, and earnings trends.
Allegion Q3 2026 Earnings Analysis: Margin Expansion & Growth Drivers
Oct 22, 2026
Read
Allegion Q2 2026: Americas Powers Growth as Europe Lags
Jul 26, 2026
Read
Allegion Q1 2026 Earnings: Revenue Growth Meets Margin Squeeze
Apr 29, 2026
Read
Allegion 2025 10-K: Pricing Power Drives Growth Amid Soft Volume
Apr 1, 2026
Read
Loading interactive diagram…
Actions | Form 10-K 10-Q | Filing Date | Period | Analysis | Revenue | Net Income |
|---|---|---|---|---|---|---|
10-Q View Filing | Oct 22, 2026 | 2026 Q3 | Analysis | $1.17B | $220.9M | |
10-Q View Filing | Jul 23, 2026 | 2026 Q2 | Analysis | $1.15B | $184.6M | |
10-Q View Filing | Apr 28, 2026 | 2026 Q1 | Analysis | $1.03B | $138.1M | |
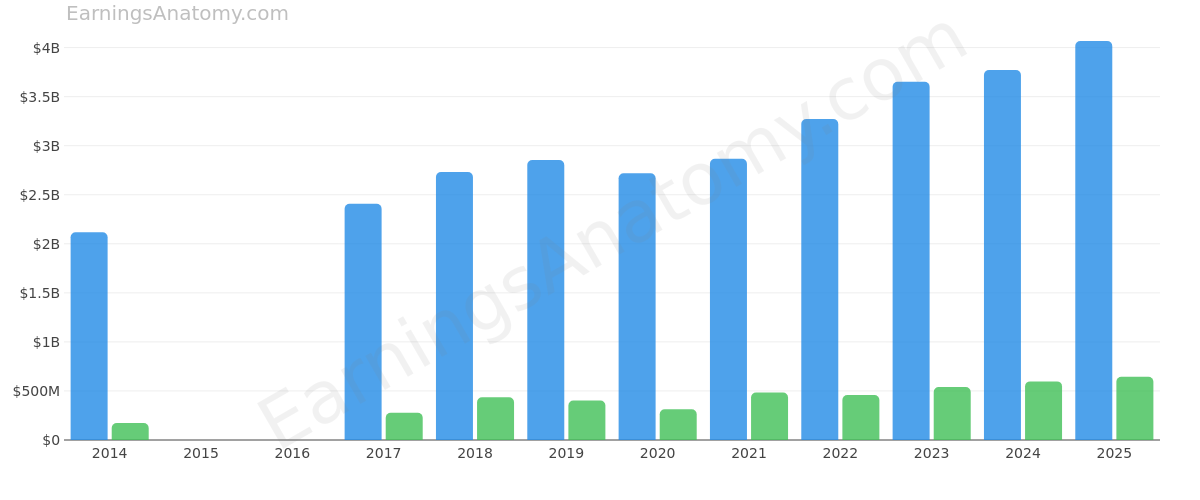
10-K View Filing | Feb 17, 2026 | 2025 FY | Analysis | $4.07B | $643.8M | |
10-Q View Filing | Oct 23, 2025 | 2025 Q3 | Analysis | $1.07B | $188.4M | |
10-Q View Filing | Jul 24, 2025 | 2025 Q2 | Analysis | $1.02B | $159.7M | |
10-Q View Filing | Apr 24, 2025 | 2025 Q1 | - | $941.9M | $148.2M | |
10-K View Filing | Feb 18, 2025 | 2024 FY | - | $3.77B | $597.5M | |
10-Q View Filing | Oct 24, 2024 | 2024 Q3 | - | $967.1M | $174.2M | |
10-Q View Filing | Jul 24, 2024 | 2024 Q2 | - | $965.6M | $155.4M | |
10-Q View Filing | Apr 25, 2024 | 2024 Q1 | - | $893.9M | $123.8M | |
10-K View Filing | Feb 20, 2024 | 2023 FY | - | $3.65B | $540.6M | |
10-Q View Filing | Oct 31, 2023 | - | - | - | - | |
10-Q View Filing | Jul 26, 2023 | - | - | - | - | |
10-Q View Filing | Apr 26, 2023 | - | - | - | - | |
10-K View Filing | Feb 22, 2023 | 2022 FY | - | $3.27B | $458.3M | |
10-Q View Filing | Oct 27, 2022 | - | - | - | - | |
10-Q View Filing | Jul 28, 2022 | - | - | - | - | |
10-Q View Filing | Apr 26, 2022 | - | - | - | - | |
10-K View Filing | Feb 15, 2022 | 2021 FY | - | $2.87B | $483M | |
10-Q View Filing | Oct 21, 2021 | - | - | - | - | |
10-Q View Filing | Jul 22, 2021 | - | - | - | - | |
10-Q View Filing | Apr 22, 2021 | - | - | - | - | |
10-K View Filing | Feb 16, 2021 | 2020 FY | - | $2.72B | $314.3M | |
10-Q View Filing | Oct 22, 2020 | - | - | - | - | |
10-Q View Filing | Jul 23, 2020 | - | - | - | - | |
10-Q View Filing | Apr 23, 2020 | - | - | - | - | |
10-K View Filing | Feb 18, 2020 | 2019 FY | - | $2.85B | $401.8M | |
10-Q View Filing | Oct 24, 2019 | - | - | - | - | |
10-Q View Filing | Jul 25, 2019 | - | - | - | - | |
10-Q View Filing | Apr 25, 2019 | - | - | - | - | |
10-K View Filing | Feb 19, 2019 | 2018 FY | - | $2.73B | $434.9M | |
10-Q View Filing | Oct 25, 2018 | - | - | - | - | |
10-Q View Filing | Jul 26, 2018 | - | - | - | - | |
10-Q View Filing | Apr 26, 2018 | - | - | - | - | |
10-K View Filing | Feb 20, 2018 | 2017 FY | - | $2.41B | $276.7M | |
10-Q View Filing | Oct 26, 2017 | - | - | - | - | |
10-Q View Filing | Jul 27, 2017 | - | - | - | - | |
10-Q View Filing | Apr 27, 2017 | - | - | - | - | |
10-K View Filing | Feb 17, 2017 | - | - | - | - | |
10-Q View Filing | Oct 27, 2016 | - | - | - | - | |
10-Q View Filing | Jul 28, 2016 | - | - | - | - | |
10-Q View Filing | Apr 28, 2016 | - | - | - | - | |
10-K View Filing | Feb 26, 2016 | - | - | - | - | |
10-Q View Filing | Oct 29, 2015 | - | - | - | - | |
10-Q View Filing | Jul 30, 2015 | - | - | - | - | |
10-Q View Filing | Apr 30, 2015 | - | - | - | - | |
10-K View Filing | Feb 27, 2015 | 2014 FY | - | $2.12B | $172.6M | |
10-Q View Filing | Oct 30, 2014 | - | - | - | - | |
10-Q View Filing | Jul 30, 2014 | - | - | - | - |
Scroll for more