
Loading company details...
Explore prior quarterly filings, historical revenue breakdowns, and earnings trends.
CBRE Q3 2026 Financial Teardown: Facilities & Advisory Drive Growth
Oct 23, 2026
Read
CBRE Q2 2026: Infrastructure Growth Masked by $168M Telford Fire-Safety Charge
Aug 21, 2026
Read
CBRE Q1 2026 Earnings: $10.5B Revenue Surge and Real Estate Profit Spike
Apr 25, 2026
Read
CBRE 2025 10-K Analysis: Strategic Resilience and Revenue Growth
Apr 3, 2026
Read
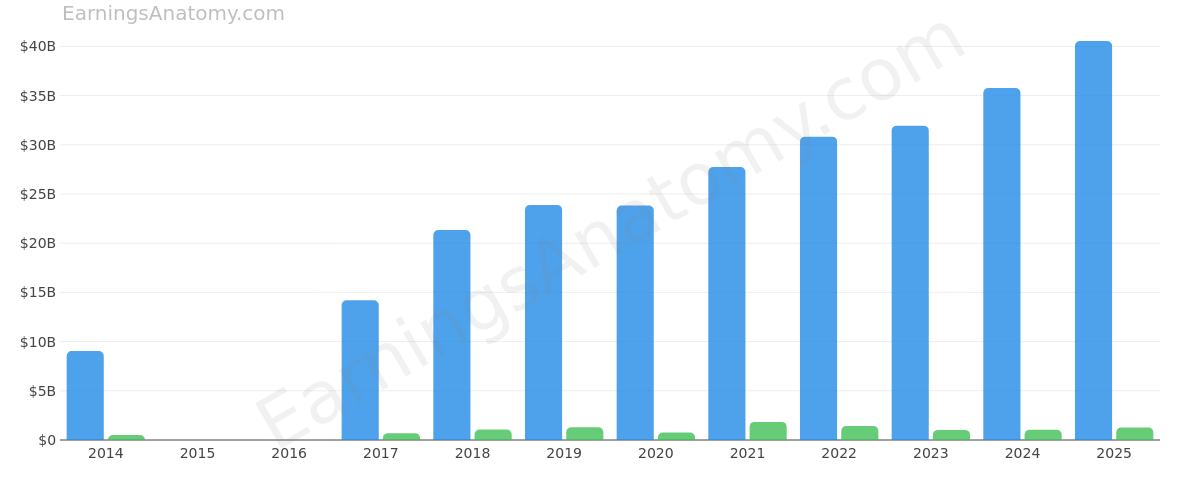
Loading interactive diagram…
Actions | Form 10-K 10-Q | Filing Date | Period | Analysis | Revenue | Net Income |
|---|---|---|---|---|---|---|
10-Q View Filing | Oct 22, 2026 | 2026 Q3 | Analysis | $11.52B | $480M | |
10-Q View Filing | Jul 29, 2026 | 2026 Q2 | Analysis | $11.23B | $247M | |
10-Q View Filing | Apr 23, 2026 | 2026 Q1 | Analysis | $10.53B | $342M | |
10-K View Filing | Feb 12, 2026 | 2025 FY | Analysis | $40.55B | $1.28B | |
10-Q View Filing | Oct 23, 2025 | 2025 Q3 | - | $10.26B | $396M | |
10-Q View Filing | Jul 29, 2025 | 2025 Q2 | Analysis | $9.75B | $239M | |
10-Q View Filing | Apr 24, 2025 | 2025 Q1 | - | $8.91B | $191M | |
10-K View Filing | Feb 14, 2025 | 2024 FY | - | $35.77B | $1.04B | |
10-Q View Filing | Oct 24, 2024 | - | - | - | - | |
10-Q View Filing | Jul 25, 2024 | - | - | - | - | |
10-Q View Filing | May 3, 2024 | - | - | - | - | |
10-K View Filing | Feb 20, 2024 | 2023 FY | - | $31.95B | $1.03B | |
10-Q View Filing | Oct 27, 2023 | - | - | - | - | |
10-Q View Filing | Jul 27, 2023 | - | - | - | - | |
10-Q View Filing | Apr 27, 2023 | - | - | - | - | |
10-K View Filing | Feb 27, 2023 | 2022 FY | - | $30.83B | $1.42B | |
10-Q View Filing | Oct 27, 2022 | - | - | - | - | |
10-Q View Filing | Aug 5, 2022 | - | - | - | - | |
10-Q View Filing | May 9, 2022 | - | - | - | - | |
10-K View Filing | Mar 1, 2022 | 2021 FY | - | $27.75B | $1.84B | |
10-Q View Filing | Oct 28, 2021 | - | - | - | - | |
10-Q View Filing | Jul 30, 2021 | - | - | - | - | |
10-Q View Filing | Apr 29, 2021 | - | - | - | - | |
10-K View Filing | Feb 24, 2021 | 2020 FY | - | $23.83B | $755.87M | |
10-Q View Filing | Oct 29, 2020 | - | - | - | - | |
10-Q View Filing | Aug 4, 2020 | - | - | - | - | |
10-Q View Filing | May 7, 2020 | - | - | - | - | |
10-K View Filing | Mar 2, 2020 | 2019 FY | - | $23.89B | $1.29B | |
10-Q View Filing | Nov 6, 2019 | - | - | - | - | |
10-Q View Filing | Aug 9, 2019 | - | - | - | - | |
10-Q View Filing | May 10, 2019 | - | - | - | - | |
10-K View Filing | Mar 1, 2019 | 2018 FY | - | $21.34B | $1.07B | |
10-Q View Filing | Nov 9, 2018 | - | - | - | - | |
10-Q View Filing | Aug 9, 2018 | - | - | - | - | |
10-Q View Filing | May 10, 2018 | - | - | - | - | |
10-K View Filing | Mar 1, 2018 | 2017 FY | - | $14.21B | $697.95M | |
10-Q View Filing | Nov 9, 2017 | - | - | - | - | |
10-Q View Filing | Aug 9, 2017 | - | - | - | - | |
10-Q View Filing | May 10, 2017 | - | - | - | - | |
10-K View Filing | Mar 1, 2017 | - | - | - | - | |
10-Q View Filing | Nov 9, 2016 | - | - | - | - | |
10-Q View Filing | Aug 9, 2016 | - | - | - | - | |
10-Q View Filing | May 10, 2016 | - | - | - | - | |
10-K View Filing | Feb 29, 2016 | - | - | - | - | |
10-Q View Filing | Nov 9, 2015 | - | - | - | - | |
10-Q View Filing | Aug 10, 2015 | - | - | - | - | |
10-Q View Filing | May 11, 2015 | - | - | - | - | |
10-K View Filing | Mar 2, 2015 | 2014 FY | - | $9.05B | $513.5M | |
10-Q View Filing | Nov 10, 2014 | - | - | - | - | |
10-Q View Filing | Aug 11, 2014 | - | - | - | - |
Scroll for more