
Loading company details...
Explore prior quarterly filings, historical revenue breakdowns, and earnings trends.
Verizon Q3 2026 Earnings: Margins Improve, but Higher Debt Costs Limit Gains
Oct 30, 2026
Read
Verizon Q2 2026 10-Q Analysis: Frontier Acquisition and Margins
Aug 2, 2026
Read
Verizon Q1 2026 Earnings: Mobile Turnaround and Frontier Deal
May 2, 2026
Read
Verizon Q3 2025 Earnings: Profit Surges on Lower Operating Expenses
Oct 30, 2025
Read
Loading interactive diagram…
Actions | Form 10-K 10-Q | Filing Date | Period | Analysis | Revenue | Net Income |
|---|---|---|---|---|---|---|
10-Q View Filing | Oct 29, 2026 | 2026 Q3 | Analysis | $34.31B | $5.32B | |
10-Q View Filing | Jul 31, 2026 | 2026 Q2 | Analysis | $34.25B | $3.95B | |
10-Q View Filing | May 1, 2026 | 2026 Q1 | Analysis | $34.44B | $5.15B | |
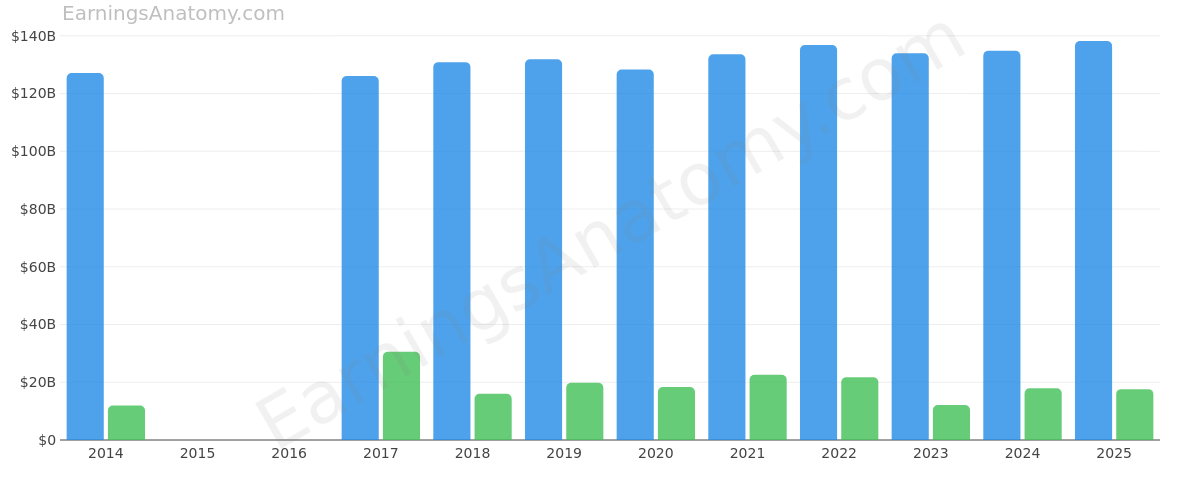
10-K View Filing | Feb 17, 2026 | 2025 FY | - | $138.19B | $17.61B | |
10-Q View Filing | Oct 29, 2025 | 2025 Q3 | Analysis | $33.82B | $5.06B | |
10-Q View Filing | Jul 25, 2025 | 2025 Q2 | - | $34.5B | $5.12B | |
10-Q View Filing | Apr 25, 2025 | 2025 Q1 | - | $33.48B | $4.98B | |
10-K View Filing | Feb 12, 2025 | 2024 FY | - | $134.79B | $17.95B | |
10-Q View Filing | Oct 25, 2024 | 2024 Q3 | - | $33.33B | $3.41B | |
10-Q View Filing | Jul 25, 2024 | 2024 Q2 | - | $32.8B | $4.7B | |
10-Q View Filing | Apr 25, 2024 | - | - | - | - | |
10-K View Filing | Feb 9, 2024 | 2023 FY | - | $133.97B | $12.1B | |
10-Q View Filing | Oct 26, 2023 | - | - | - | - | |
10-Q View Filing | Jul 28, 2023 | - | - | - | - | |
10-Q View Filing | Apr 27, 2023 | - | - | - | - | |
10-K View Filing | Feb 10, 2023 | 2022 FY | - | $136.84B | $21.75B | |
10-Q View Filing | Oct 25, 2022 | - | - | - | - | |
10-Q View Filing | Jul 28, 2022 | - | - | - | - | |
10-Q View Filing | Apr 27, 2022 | - | - | - | - | |
10-K View Filing | Feb 11, 2022 | 2021 FY | - | $133.61B | $22.62B | |
10-Q View Filing | Oct 26, 2021 | - | - | - | - | |
10-Q View Filing | Jul 28, 2021 | - | - | - | - | |
10-Q View Filing | Apr 27, 2021 | - | - | - | - | |
10-K View Filing | Feb 25, 2021 | 2020 FY | - | $128.29B | $18.35B | |
10-Q View Filing | Oct 27, 2020 | - | - | - | - | |
10-Q View Filing | Jul 28, 2020 | - | - | - | - | |
10-Q View Filing | Apr 27, 2020 | - | - | - | - | |
10-K View Filing | Feb 21, 2020 | 2019 FY | - | $131.87B | $19.79B | |
10-Q View Filing | Oct 30, 2019 | - | - | - | - | |
10-Q View Filing | Aug 8, 2019 | - | - | - | - | |
10-Q View Filing | Apr 26, 2019 | - | - | - | - | |
10-K View Filing | Feb 15, 2019 | 2018 FY | - | $130.86B | $16.04B | |
10-Q View Filing | Oct 30, 2018 | - | - | - | - | |
10-Q View Filing | Jul 31, 2018 | - | - | - | - | |
10-Q View Filing | May 1, 2018 | - | - | - | - | |
10-K View Filing | Feb 23, 2018 | 2017 FY | - | $126.03B | $30.55B | |
10-Q View Filing | Oct 26, 2017 | - | - | - | - | |
10-Q View Filing | Aug 3, 2017 | - | - | - | - | |
10-Q View Filing | Apr 27, 2017 | - | - | - | - | |
10-K View Filing | Feb 21, 2017 | - | - | - | - | |
10-Q View Filing | Oct 26, 2016 | - | - | - | - | |
10-Q View Filing | Jul 29, 2016 | - | - | - | - | |
10-Q View Filing | Apr 28, 2016 | - | - | - | - | |
10-K View Filing | Feb 23, 2016 | - | - | - | - | |
10-Q View Filing | Oct 27, 2015 | - | - | - | - | |
10-Q View Filing | Jul 28, 2015 | - | - | - | - | |
10-Q View Filing | Apr 28, 2015 | - | - | - | - | |
10-K View Filing | Feb 23, 2015 | 2014 FY | - | $127.08B | $11.96B | |
10-Q View Filing | Oct 28, 2014 | - | - | - | - | |
10-Q View Filing | Jul 29, 2014 | - | - | - | - |
Scroll for more