Loading blog posts...
October 30, 2026 • 4 min read
Visual discovery platform Pinterest, Inc. (NYSE: PINS) has released its financial results for the third quarter ended September 30, 2026. The goal of this post is to dig into the income statement from the company's latest 10-Q filing to see how things are going, examine its cost structure, and uncover what we can learn about its ongoing monetization and capital allocation shifts.
For the third quarter of 2026, Pinterest generated $1.17 billion in total revenue, representing a solid 12% increase compared to the $1.05 billion recorded in Q3 2025. This growth was underpinned by a steady rise in platform engagement: global Monthly Active Users (MAUs)—the number of unique users who visited Pinterest at least once during a 30-day window—climbed 10% year-over-year to 661 million, driven by continuous investments in AI-powered personalization and content relevance.
Geographically, revenue remains heavily concentrated in North America:
While North America remains the primary financial engine, closing the monetization gap across its massive international user base continues to be a central long-term opportunity.
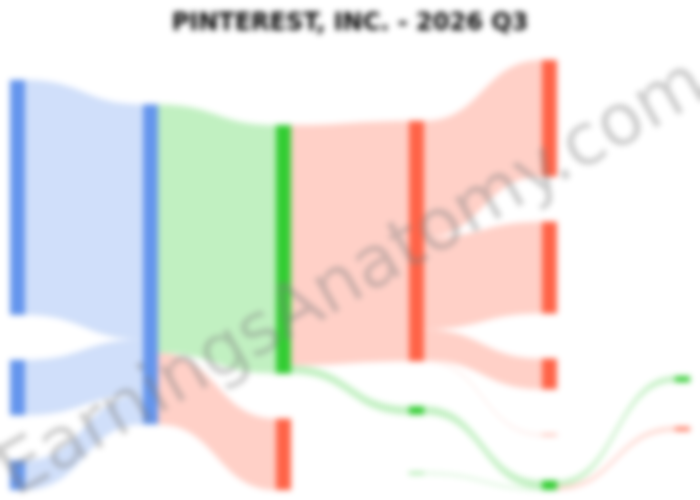
Despite top-line expansion and a healthy 77.7% gross margin ($912.3 million in gross profit), Pinterest’s GAAP profitability narrowed considerably during the quarter. Operating income fell 48% year-over-year to $30.3 million (a 2.6% operating margin, down from 5.6% in Q3 2025), while net income dropped 77% to $21.5 million ($0.04 per diluted share), compared to $92.1 million ($0.13 per diluted share) a year ago.
Two primary factors explain this divergence between revenue growth and GAAP net income:
When stripping out non-cash items like SBC, depreciation, and one-time restructuring charges, Pinterest's non-GAAP Adjusted EBITDA—a metric used to evaluate core operational cash generation—actually rose 11% year-over-year to $339.2 million.
Looking beyond the income statement lines reveals why Pinterest’s interest income fell so sharply: the company has aggressively deployed cash over the first nine months of 2026.
During the year, Pinterest issued $1.0 billion in convertible notes and utilized its liquidity to repurchase over $2.0 billion of its Class A common stock, shrinking its basic weighted-average share count by 16% year-over-year (from 677.8 million to 567.2 million shares). Furthermore, Pinterest deployed $449.2 million in cash toward acquisitions and intangibles, highlighted by the buyout of connected TV (CTV) performance advertising platform tvScientific, which added $375.1 million in goodwill to the balance sheet.
Pinterest is navigating a fiercely competitive digital advertising market alongside giants like Meta, Alphabet, TikTok, and Amazon. Its acquisition of tvScientific and heavy R&D investments into AI and machine learning show a clear push to capture cross-channel performance ad budgets and prove ad effectiveness to merchants. With $1.47 billion in cash and marketable securities and $881.9 million in year-to-date free cash flow, Pinterest has plenty of financial firepower—though investors will be watching closely to see if its elevated R&D and stock-based compensation eventually translate into expanding GAAP margins.
Last updated: October 30, 2026