Loading blog posts...
October 23, 2026 • 3 min read
Analyzing an income statement offers a clear window into how well a corporate strategy translates into bottom-line reality. For Omnicom Group Inc. (NYSE: OMC), one of the world's preeminent marketing and advertising holding companies alongside global peers like Publicis Groupe and WPP, our goal today is to dig into their income statement from the latest 10-Q filing to see how the company is performing and uncover the key operational lessons behind the figures.
Omnicom delivered consolidated revenue of $6.42 billion for the third quarter of 2026, marking a 59.1% increase compared to $4.04 billion in the prior-year period. While the majority of this top-line surge reflects the inclusion of Interpublic Group (IPG) following the close of their landmark combination in late 2025, underlying organic performance remained robust. Omnicom reported 7.2% organic revenue growth across its core operations—a metric that strips out foreign currency swings and net impacts from acquisitions and dispositions to assess true baseline commercial demand.
By discipline, revenue showed broad-based expansion:
Geographically, North America remains Omnicom’s largest engine, generating $3.97 billion (61.8% of revenue), followed by Europe at $1.45 billion (22.6%) and Asia-Pacific at $606.5 million (9.5%).
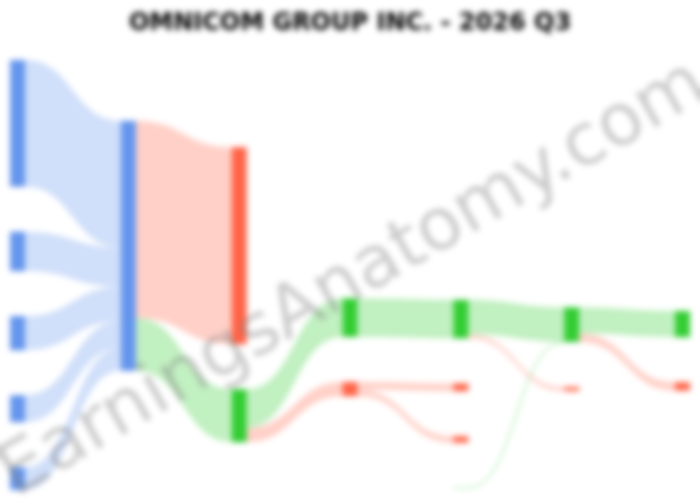
A visual breakdown reveals how revenue flows through operating costs to bottom-line net income:
Because Omnicom manages client deliverables, shared resources, and media execution centrally, cost of services is accounted for as a unified operating layer rather than tracked division-by-division. Total cost of revenue came in at $5.06 billion, led by $4.59 billion in salary and service costs, $499.3 million in occupancy and related overhead, and $84.7 million in severance and repositioning costs, offset by $106.8 million in net gains from assets held for sale and agency dispositions.
Selling, general, and administrative (SG&A) expenses totaled $200.9 million (3.1% of revenue), while depreciation and amortization rose to $166.6 million, reflecting amortization of acquired intangible assets. Operating income jumped 87.1% year-over-year to $991.7 million, boosting operating margin by 230 basis points to 15.4% (up from 13.1%).
Non-GAAP EBITA—earnings before interest, taxes, and amortization of acquired intangibles, widely monitored by agency analysts to gauge core cash generation—rose 101.6% to $1.11 billion, reaching an EBITA margin of 17.3%. After accounting for net interest expense of $104.2 million, income taxes of $215.4 million, and noncontrolling interests, net income attributable to Omnicom reached $656.0 million, or $2.38 per diluted share (up 36.0% from $1.75).
Omnicom's post-merger integration shows measurable operational progress, but it also carries new financial responsibilities. Total debt stood at $10.02 billion at the end of September 2026, resulting in net debt (total debt less $3.80 billion in cash and cash equivalents) of $6.22 billion, compared to $2.24 billion at year-end 2025. Financing this increased leverage lifted quarterly interest expense to $132.8 million.
Even so, Omnicom returned capital aggressively, deploying $3.21 billion to repurchase shares during the first nine months of the year while declaring an increased quarterly dividend of $0.80 per share. As traditional agency networks face increasing competition from tech consultancies and rapidly advancing automated generative AI platforms, Omnicom's expanded scale and unified data platforms will be pivotal in maintaining client retention and widening operating margins.
Last updated: October 23, 2026
Explore prior quarterly filings, historical revenue breakdowns, and earnings trends.
Omnicom Q1 2026: Unpacking the $6.2B Post-Merger Earnings
May 2, 2026
Read
Omnicom (OMC) 2025 10-K: The True Cost of the $8.9B IPG Mega-Merger
Mar 25, 2026
Read
Omnicom's Q3 2025 10-Q: Revenue Growth Meets the Margin Squeeze
Oct 23, 2025
Read
Omnicom Q2 2025: Why Profits Fell Despite Revenue Growth
Jul 17, 2025
Read