Loading blog posts...
July 24, 2026 • 4 min read
The goal here is to dig into Nasdaq’s income statement and see how the business is performing beneath the headline EPS number. Nasdaq is best known for its stock exchanges, but today it is also a major provider of market data, index products, anti-financial-crime software, regulatory technology, and capital markets infrastructure. Its latest Form 10-Q filing shows a strong quarter, with growth coming from both market activity and higher-value recurring businesses.
For Q2 2026, Nasdaq reported total revenue of $2.53 billion, up 20.6% from $2.10 billion a year ago. But for exchanges, gross revenue can be noisy because it includes transaction-related amounts that are largely offset by rebates and fees. After subtracting $1.03 billion of transaction-based expenses, Nasdaq’s revenues less transaction-based expenses — a cleaner measure similar to net revenue — were $1.50 billion, up 14.9% year over year.
Operating leverage was visible: operating income rose 25.2% to $712 million, while operating expenses increased a more modest 6.9% to $788 million. Net income was $507 million, up 12.2%, and diluted EPS increased to $0.89 from $0.78.
The gap between operating income growth and net income growth is partly explained by taxes and below-the-line items. Nasdaq’s effective tax rate rose to 22.4% from 17.5%, largely because the prior-year quarter benefited from tax items related to former Adenza employees. The prior-year quarter also included a $39 million gain on divestitures, while Q2 2026 had no such gain.
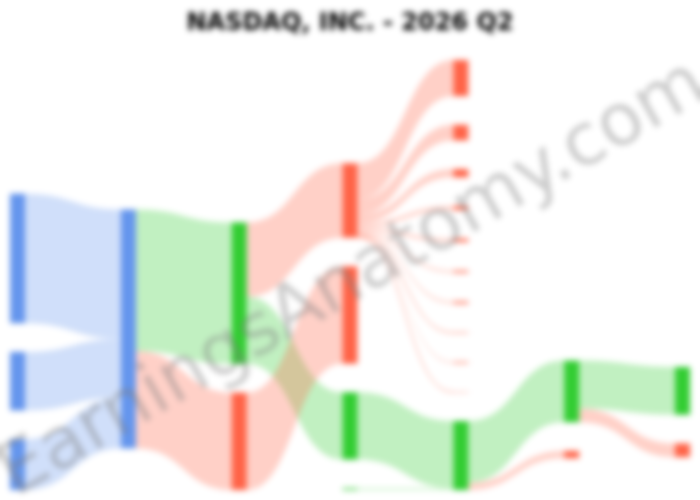
The flow chart highlights an important feature of Nasdaq’s model: almost all reported cost of revenue is tied to Market Services, where transaction rebates and exchange-related fees move with trading volumes. Capital Access Platforms and Financial Technology do not report comparable cost-of-revenue lines in this segment presentation, making their revenue streams look much more scalable.
Nasdaq’s Capital Access Platforms segment — which includes listings, market data, indexes, and workflow tools — generated $621 million of revenue, up 19.4%. Segment operating income was $394 million, a robust 63% operating margin.
The standout was the Index business, where revenue jumped 38.4% to $271 million. Nasdaq said exchange-traded product assets under management tracking its indexes ended the period at $1.11 trillion, with trailing-12-month net inflows of $109 billion. Average ETP AUM also exceeded $1 trillion for the first time.
The listings environment also improved. Nasdaq said it welcomed 26 operating company IPOs in the quarter and achieved a 74% win rate across eligible U.S. operating companies, direct listings, and SPAC business combinations. The filing specifically notes SpaceX among the largest IPOs on U.S. exchanges, with $86 billion in offering proceeds — a headline event that likely helped reinforce Nasdaq’s brand with issuers.
Nasdaq’s Financial Technology segment — including anti-money-laundering tools, surveillance, regulatory reporting, and capital markets software such as Adenza’s Calypso and AxiomSL — reported $539 million of revenue, up 16.3%. Operating income was $250 million, a 46% margin.
Growth was broad-based:
Nasdaq also reported strong recurring revenue indicators. Annualized recurring revenue, or ARR — the annualized value of active recurring contracts — continued to expand across these businesses. The company cited 58 new clients, 7 cross-sells, and 107 upsells in Financial Technology during the quarter, suggesting the Adenza acquisition is still feeding the broader platform strategy.
Market Services remains Nasdaq’s largest segment by gross revenue, at $1.37 billion, up 24.6%. After transaction-based expenses, segment net revenue was $340 million, up 11.2%.
The drivers were straightforward: heavier trading activity and stronger market share in key areas. U.S. equity options industry average daily volume rose to 66.5 million contracts from 52.5 million, while Nasdaq’s total options matched market share was 29.1%. Cash equity trading net revenue increased 18.7% to $160 million, helped by higher U.S. industry volumes and stronger matched market share.
Nasdaq’s Q2 income statement shows a company benefiting from both cyclical market activity and structural growth in higher-margin technology, index, and data businesses. Expenses are rising — especially compensation, technology infrastructure, marketing, and occupancy — but revenue growth outpaced cost growth, lifting operating margins to 28.1% and net margin to 20.0%.
The key challenge is sustaining growth as market volumes, IPO activity, and index-linked AUM can fluctuate. Still, Nasdaq’s mix increasingly resembles a financial infrastructure and software platform rather than a pure exchange operator. In a competitive landscape that includes Intercontinental Exchange, Cboe, CME Group, Bloomberg, and specialized fintech vendors, that diversification remains Nasdaq’s central strategic advantage.
Last updated: July 24, 2026