Loading blog posts...
October 23, 2026 • 4 min read
When market uncertainty rises, CME Group Inc. (NASDAQ: CME) usually stands to benefit. As the world's leading derivatives marketplace, CME Group provides the financial plumbing where institutions and traders hedge risks across interest rates, equity indexes, foreign exchange, energy, agricultural commodities, and metals. Today, our goal is to dig into the income statement from CME Group's latest 10-Q filing for the third quarter of 2026 to see how the business is performing and what we can learn from its underlying numbers.
CME Group delivered a strong third quarter, generating $1.74 billion in total revenue, up 13% compared to the $1.54 billion recorded in Q3 2025. Because the company operates largely on scalable electronic platforms (with 93% of contract volume traded on CME Globex), revenue growth outpaced expense growth, lifting operating income by 17% to $1.14 billion—an impressive 65.7% operating margin. Net income rose 14% year-over-year to $1.04 billion, while diluted earnings per share jumped 16% to $2.89.
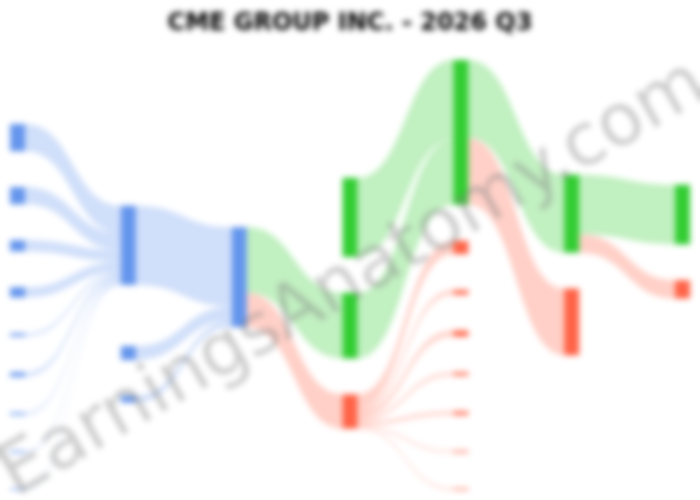
The visual breakdown below illustrates how CME Group's third-quarter revenues flowed through various product lines and operating expenses down to the bottom line.
The primary engine of CME’s business is Clearing and transaction fees, which brought in $1.38 billion (up 12% year-over-year) and accounted for 79% of total revenue. This growth was fueled by a 16% jump in aggregate average daily volume (ADV) to 29.4 million contracts, which easily offset a 3% dip in the average rate per contract (RPC)—the average fee CME collects per trade—from $0.702 down to $0.679.
What makes this quarter particularly notable is that volume growth wasn't confined to a single market anomaly; every major product line saw double-digit percentage increases in daily trading activity:
On the cost side, total operating expenses rose a modest 5% to $595.9 million. Two areas stood out: licensing and other fee agreements jumped 28% to $104.2 million (a direct result of the surge in Nasdaq and S&P equity index trading, which requires royalty payments to index providers), and technology expenses increased 13% to $80.9 million, driven by third-party support costs for CME’s ongoing Google Cloud transformation project.
Looking below the operating line, readers examining the income statement might notice two massive, nearly offsetting numbers: $1.42 billion in investment income and $1.26 billion in other non-operating expenses. This is a unique feature of CME's clearinghouse model. At the end of Q3, CME held $155.2 billion in cash performance bonds and guaranty fund contributions—collateral posted by clearing members to back their trades. CME invests this cash and earns interest (investment income), passing the vast majority of those earnings back to the clearing firms (recorded as non-operating expense) while retaining a small net spread.
Finally, a significant capital allocation shift occurred in 2026. All 4.58 million shares of Series G preferred stock were converted into Class A common stock earlier in the year. To offset this dilution and return capital to shareholders, CME aggressively ramped up share buybacks, repurchasing $533.5 million worth of stock in Q3 alone ($1.77 billion over the first nine months, compared to just $8.2 million in the same period last year). With roughly $1.0 billion remaining on its repurchase authorization, rock-solid credit ratings (AA-/Aa3), and double-digit volume momentum across its core markets, CME Group enters the final stretch of 2026 in a commanding financial position.
Last updated: October 23, 2026